Planetary Nebula | |||
| « Previous | Back to Astrophotography Gallery | Next » | |
|
A star (like our sun) is a gigantic sphere of mostly gaseous hydrogen and helium, large enough that its self-gravity creates enough temperature and pressure in the core to fuse hydrogen into helium. This nuclear fusion is the source of the energy and light that the star emits, but eventually all stars (and our sun) will run out of fuel, and what happens next is entirely dependent on the star's initial mass. Ironically, small less massive stars can last for trillions of years, while large, massive stars live "fast and furious lives," burning through their fuel supply relatively quickly, and may last only a few million years. Stars that have an intial mass between 0.8 and 8 x the sun's will first evolve into red giants when their core hydrogen fuel is used up. The end of central hydrogen fusion causes the core to contract, while the star's outer envelope expands and cools, and the star becomes a red giant. As the core contracts it begins fusing helium into carbon and oxygen. Eventually core helum is exhausted, and stars of this mass range reach the end of the line; the core contracts while the star's outer layers cool and expand, and the star sheds these outer layers forming a "planetary nebula" (funny name, nothing to do with planets). The carbon-oxygen core that is left behind forms a white dwarf that slowly cools over billions of years, but produces no new energy. The white dwarf emits lots of ultraviolet photons, which excite and/or ionize the gas shell, causing the gas to emit visible light photons as the electrons recombine with ionized atoms and spontaneously cascade down to lower energy levels. The glowing gas shells do not last very long (in astronomical terms, at least), and after 10,000 - 100,000 years the shells dissipate into the interstellar medium, providing material for new star formation. *** This page is really a "collector page" that provides links to a more detailed page for each image. The common thread here is to link all of my images of planetary nebula along with an overview of what they represent. Clicking on the images below will take you to a separate web page with a larger image of that nebula *** | |
 |
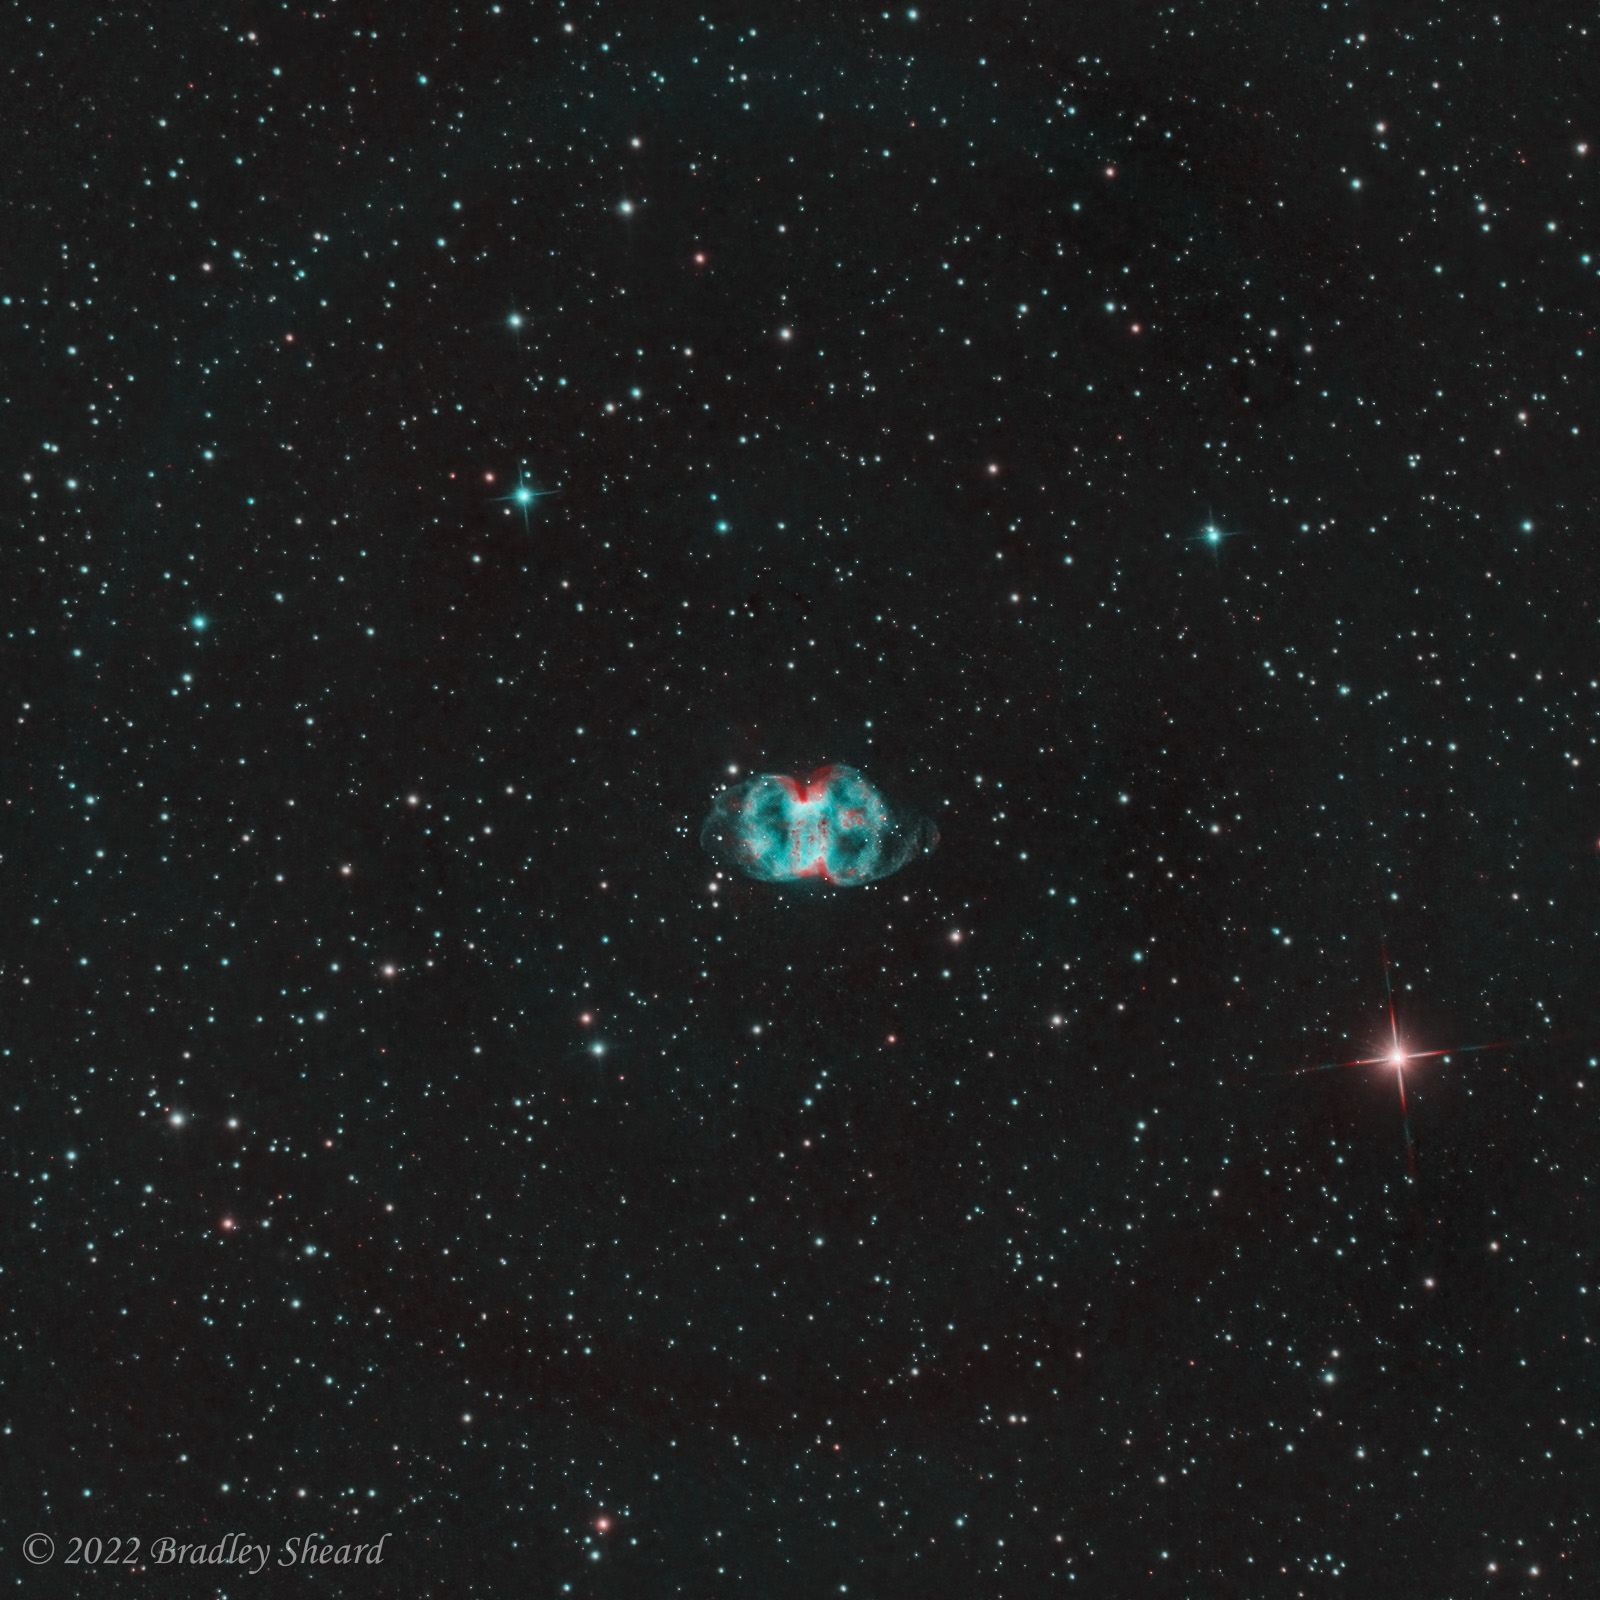 |
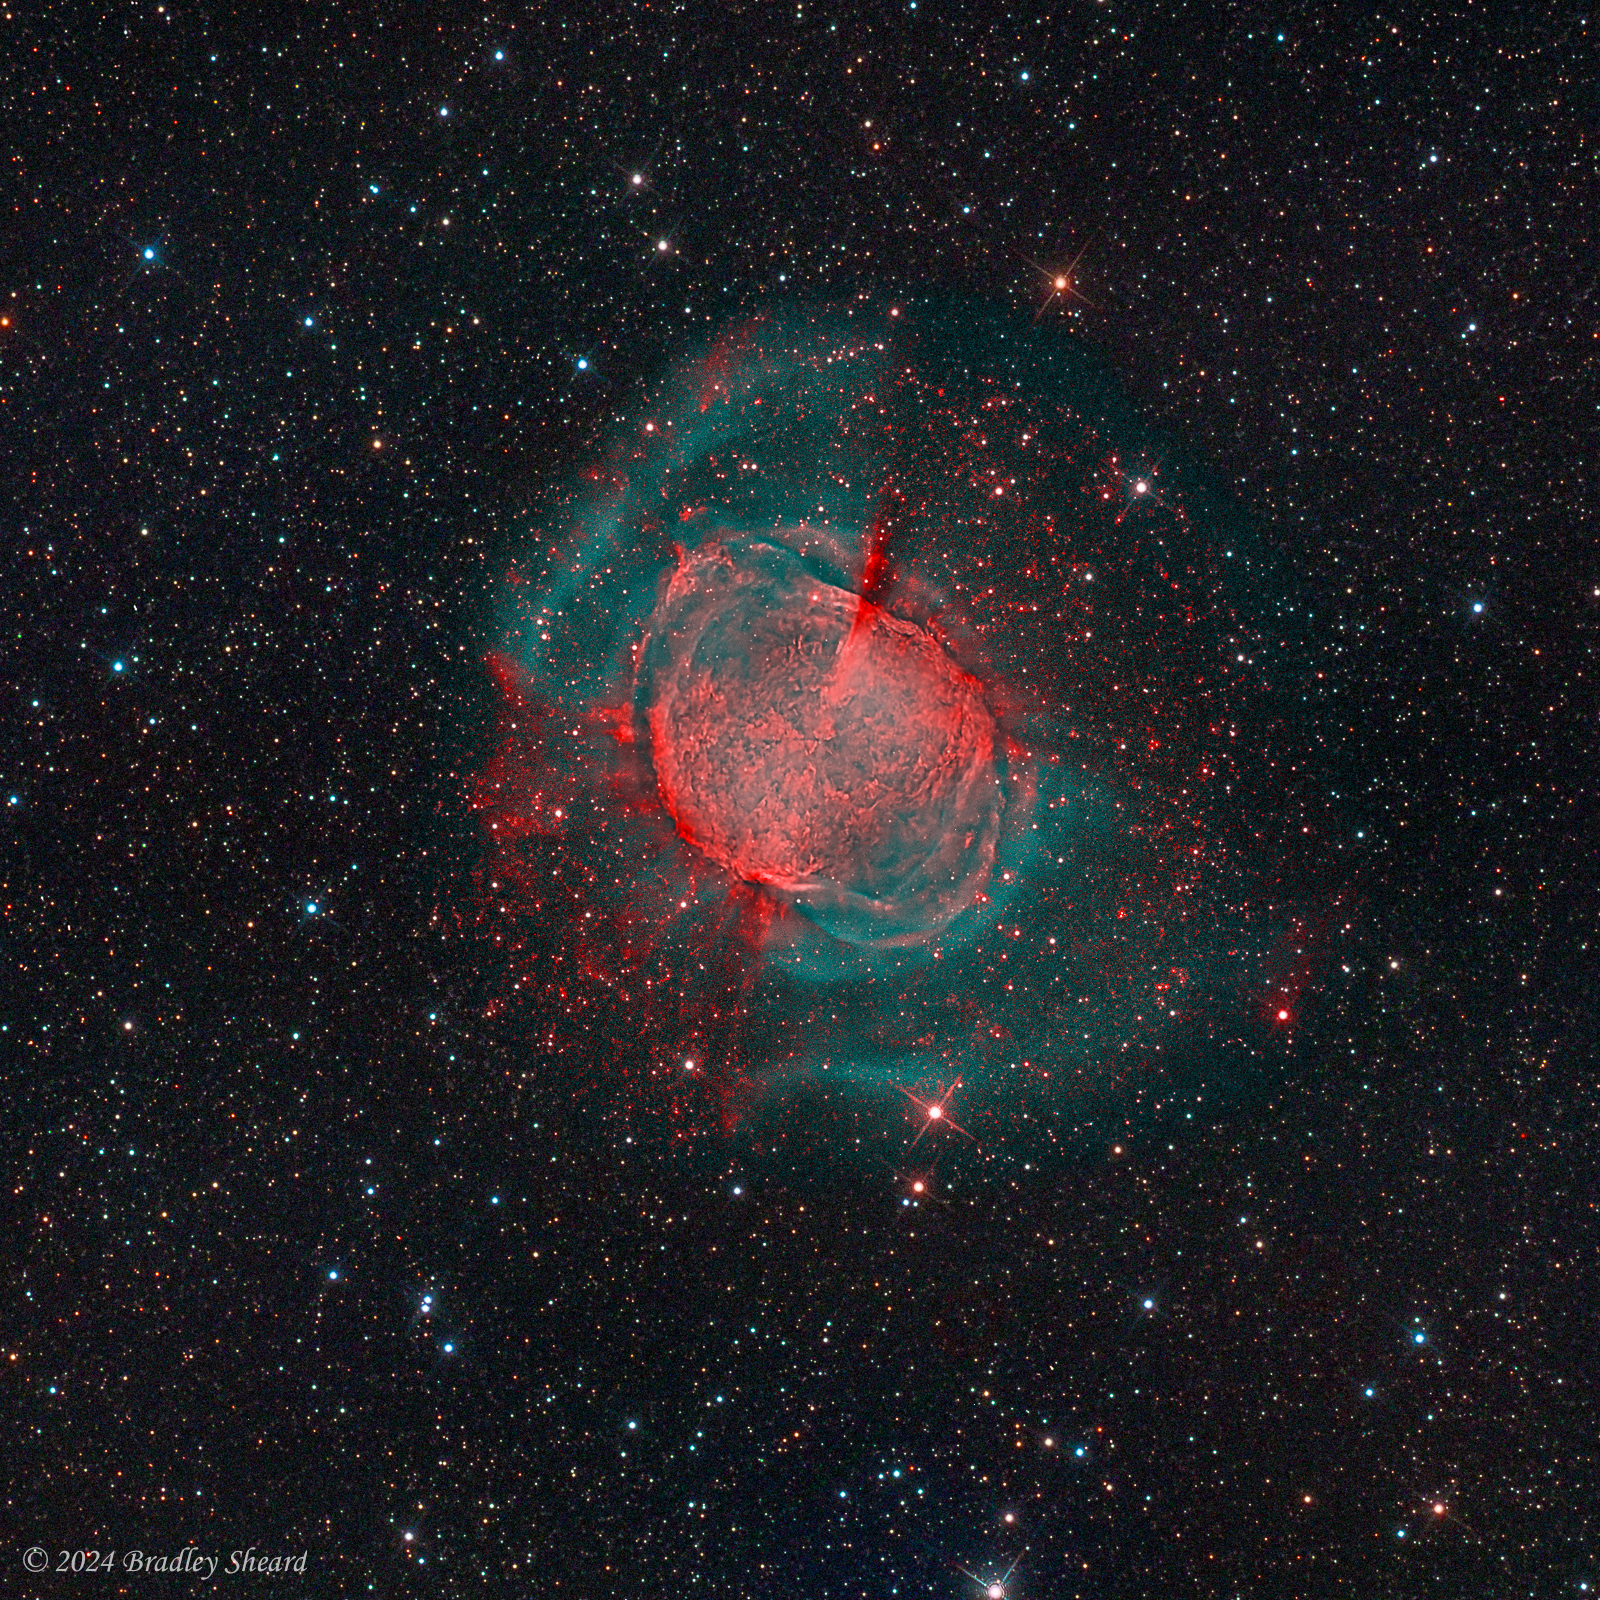
| 66. M27: The Dumbbell Nebula | 70. M76: The Little Dumbbell Nebula |
 |
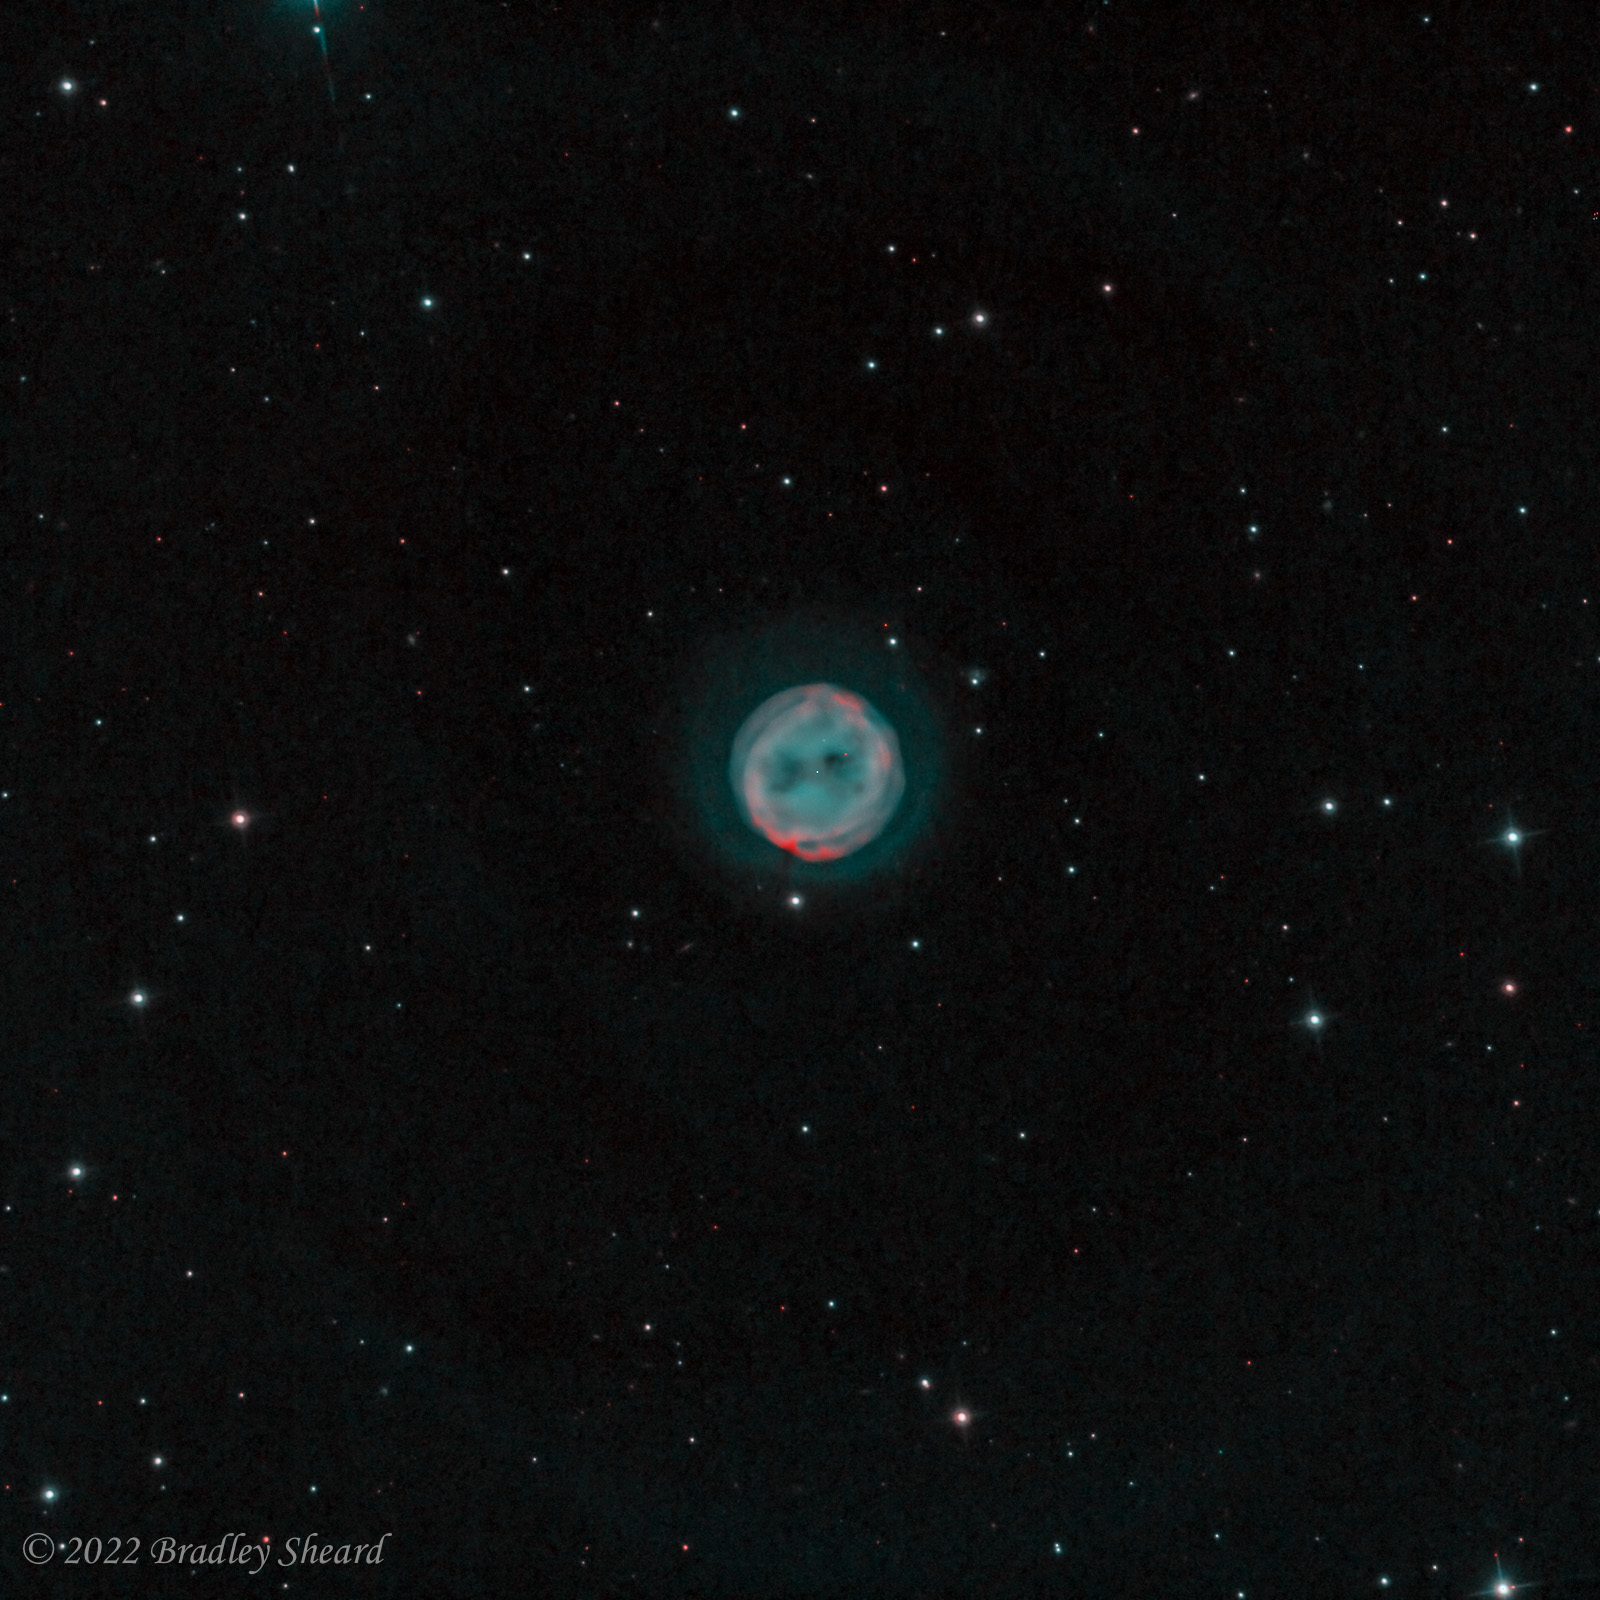 |
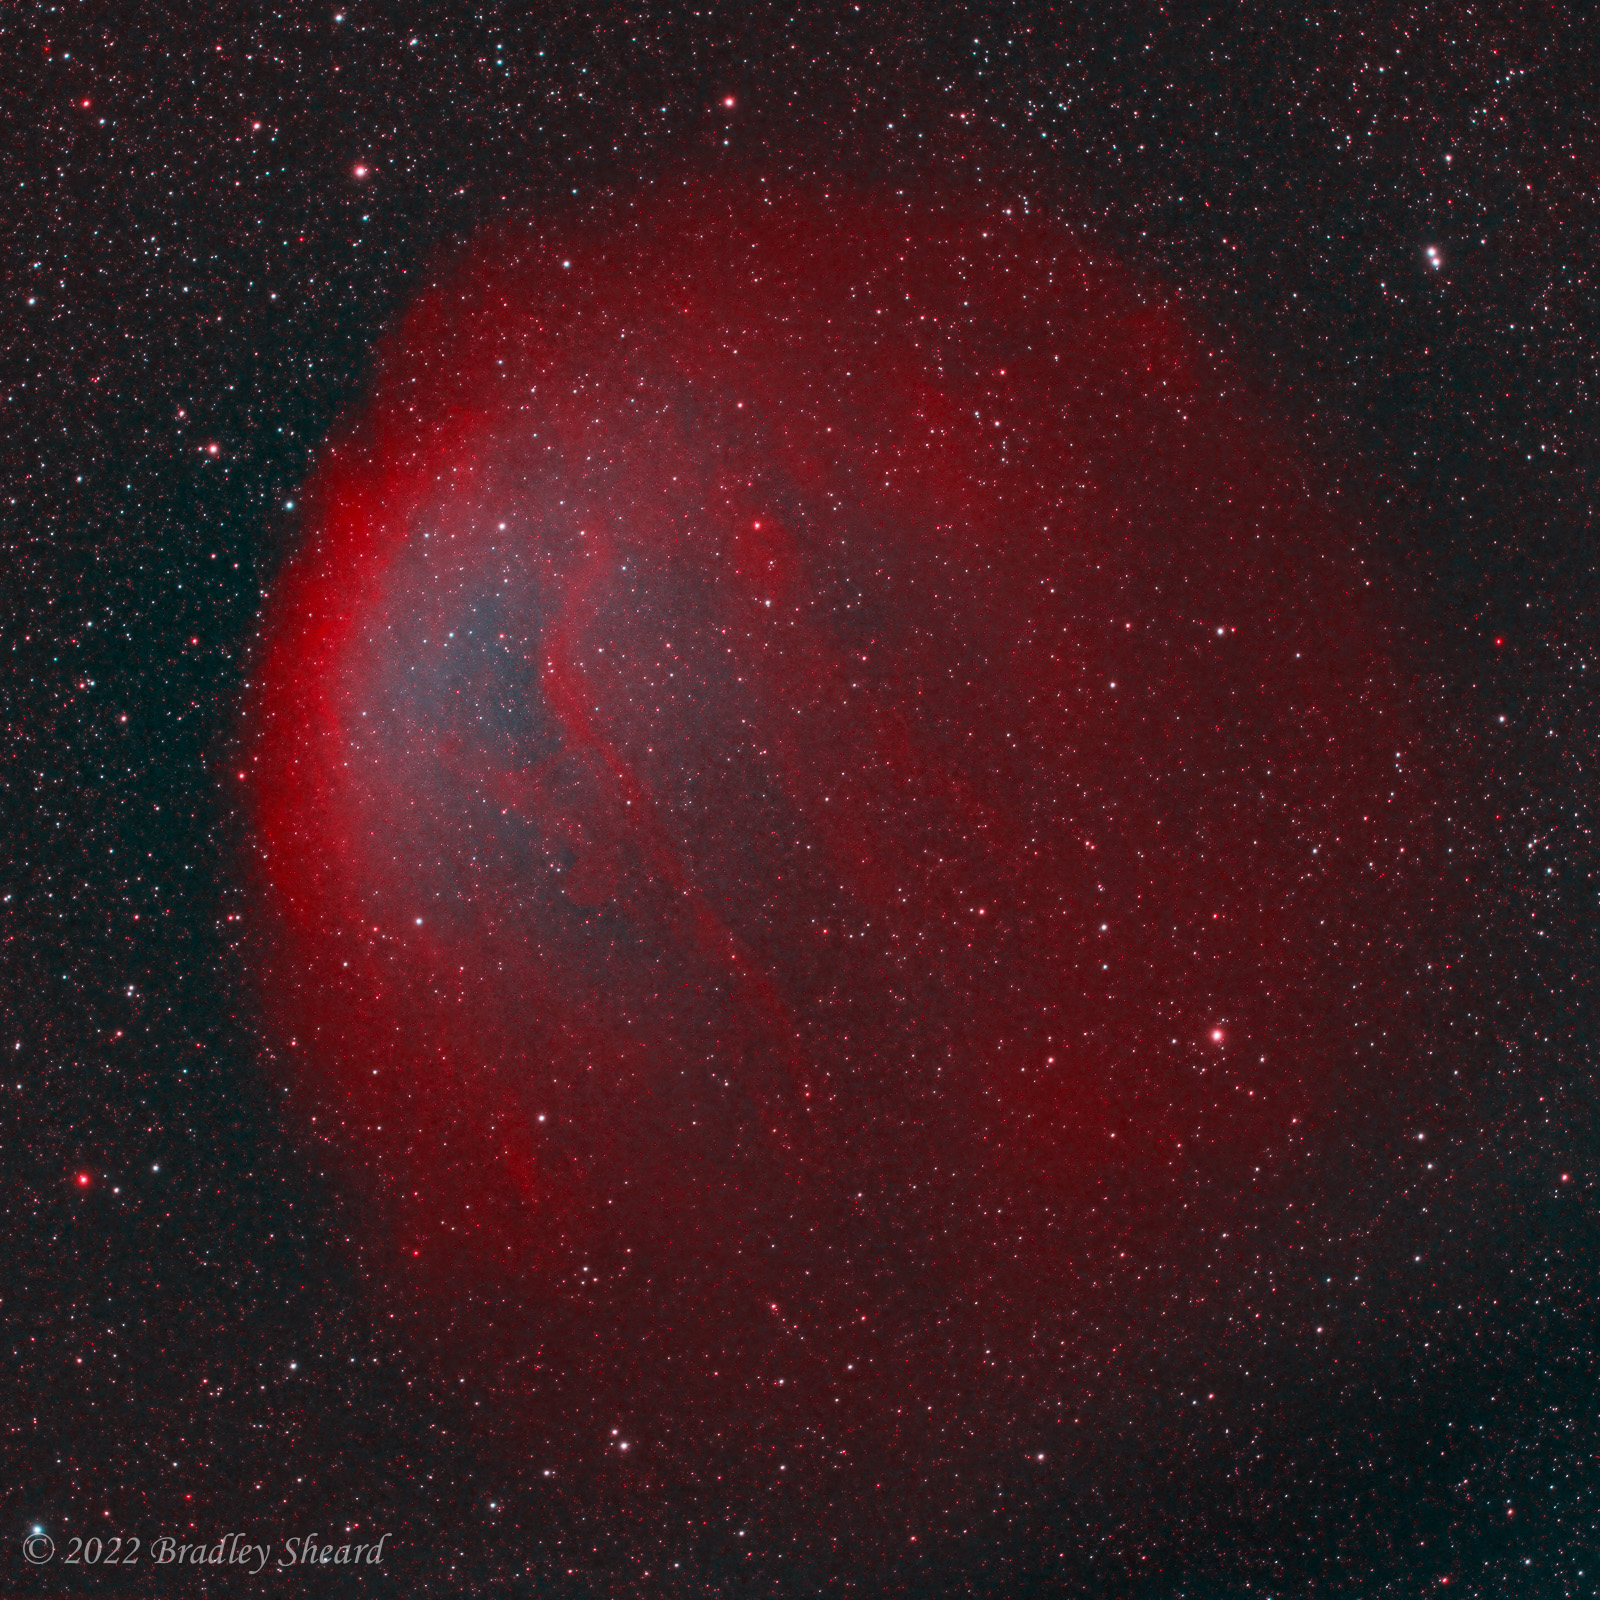
| 71. Sharpless 2-216 (PN G158.5+00.7) | 73. M97 "Owl Nebula" |
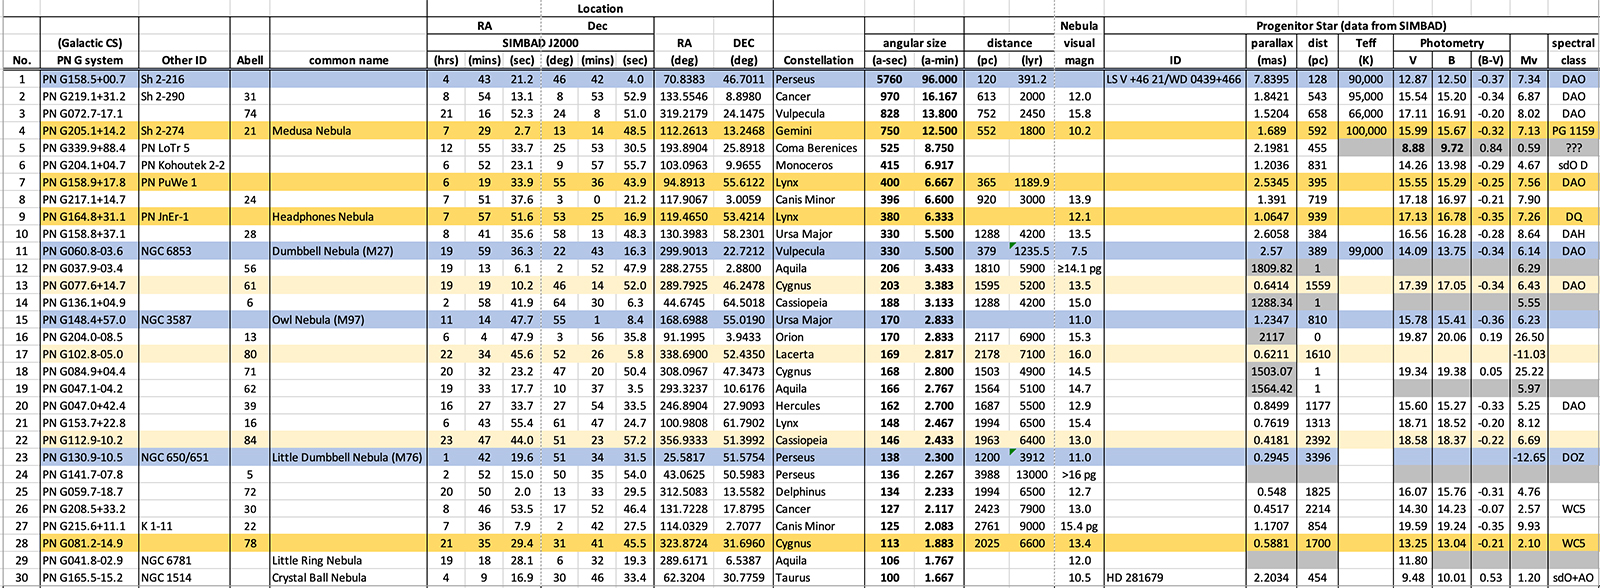
Table of Relatively Large Planetary Nebula |
The following table of relatively large Planetary Nebula (in the northern sky) was compiled from a variety of sources. As a fascinating and colorful stage of stellar evolution, it seems like a good imaging project to work on. The items highlighted in blue are those I've photographed and posted images of, and the others are a goal for future imaging. |
 |
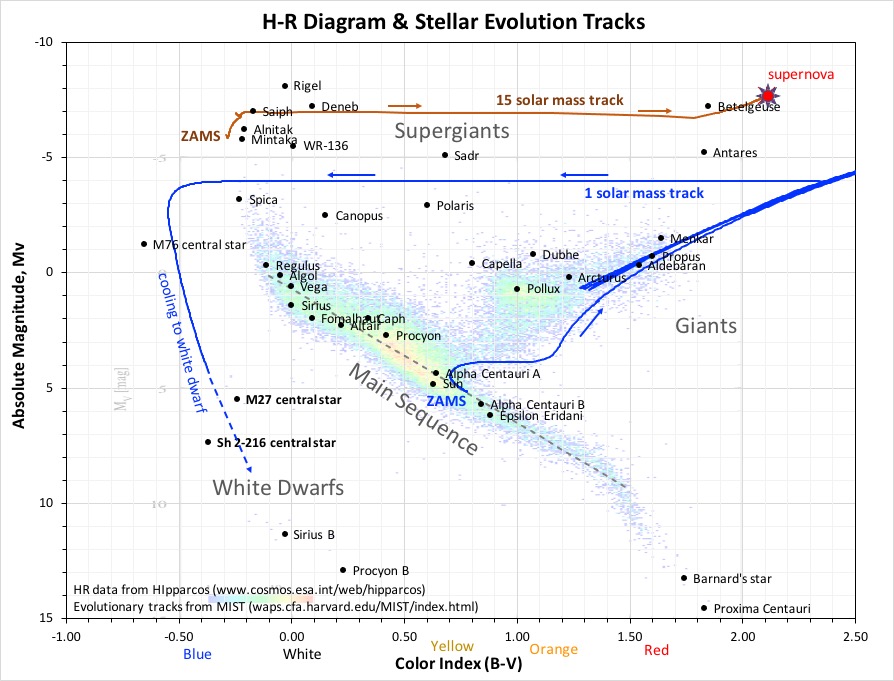
Color-Magnitude / H-R Diagram and Stellar Evolution Tracks |
In the early twentieth century two astronomers, Ejnar Hertzsprung and Henry Russell, independently studied available data for stars whose properties had been accurately determined, and created plots of the stars absolute magnitude on the vertical axis vs. their spectral type on the horizontal axis. The resulting scatter plots showed that the majority of stars fell on a nearly straight diagonal line, now called the 'Main Sequence,' from the upper left to the lower right of the plot. These diagrams, now called Hertzsprung-Russell (H-R) or color-magnitude diagrams, became an important tool in the study of stellar evolution. Below is an example to illustrate the basic H-R Diagram (annotations added). The majority of stars lie along the Main Sequence, a roughly S-shaped diagonal line running from upper left to lower right. The vertical scale of the plot is the absolute magnitude of the star (the stars brightness), and the horizontal scale is the (B-V) color index (proportional to the stars surface temperature). Stars generally spend the majority of their lives on the Main Sequence fusing hydrogen to helium in their cores. The hottest, bluest and most massive stars burn the brightest, but have the shortest lives, and lie to the upper left of the diagram. The coolest, reddest and least massive stars live the longest, and lie to the lower right side of the diagram. Once a star has exhausted the hydrogen in its core, it migrates toward the right side of the H-R diagram as its core contracts, but the outer envelope expands and surface temperature drops, evolving into a Red Giant or Red Supergiant. The remainder of the stars evolution, and eventual death, is determined by its initial mass. The (background image) color-magnitude diagram shown here is from the Hipparcos catalogue and can be found here Hipparcos Hertzsprung-Russell Diagrams Also shown are two Stellar Evolution Tracks for stars of 1 and 15 solar masses to illustrate the dramatically different end-lives of stars of different masses. Each of the tracks shows how a star of a given mass progresses through the H-R diagram during its lifetime. The evolution tracks shown here are based on theoretical models from the MIST Database (link below). Some bright, named stars are also shown in the diagram, including the Sun. MIST: MESA Isochrones and Stellar Tracks Both tracks in the diagram below start at the Zero Age Main Sequence (ZAMS) point. Stars that have an intial mass between 0.8 and 8 x the sun's, will first evolve into red giants when their core hydrogen fuel is used up. (The blue track is for a 1 solar mass star.) The end of central hydrogen fusion causes the core to contract, while the star's outer envelope expands and cools, shifting the light to cooler red wavelengths, and the star migrates to the upper right of the H-R diagram. As the core contracts, its pressure and temperature rises until fusion of helium, now the core's major constituent, becomes possible. The core is now fusing helium into carbon and oxygen, while a shell surrounding the core continues to fuse hydrogen into helium, adding more fuel to the core. As core helum is exhausted, stars of this mass range reach the end of the line. During this phase the star develops a super-wind, shedding much of its outer envelope while the hot core contracts and its effective temperature rises, causing it to migrate to the left on the H-R diagram. When the core reaches an effective temperature on the order of 30,000 K, the photons emitted are energetic enough to cause the extended shell of expelled material to glow, creating the often beautiful planetary nebula (pictured above). This nebula is relatively short-lived, lasting for only 10,000-100,000 years. The carbon-oxygen core that is left behind forms a white dwarf that slowly cools and contracts over billions of years, but produces no new energy via nuclear burning, and falls down the left-hand side of the H-R diagram. Stars with initial masses greater than 8x the sun's, however, have a much more interesting end-of-life story. (The orange track on the diagram below is for a 15 solar mass star.) After exhausting the hydrogen fuel in their core, they too expand into red giants, while their cores contract and heat up, eventually transitioning to fusing helium into carbon and oxygen, while a shell of hydrogen surrounding the core continues to create helium and feed the core. After the helium is used up, these massive stars have enough gravity to achieve higher temperatures and pressures in their core and successively fuse heavier elements still, eventually creating a nickel-iron core surrounded by shells of successively lighter elements with a structure like an onion. As the star progresses through various nuclear burning stages, it maintains a nearly constant luminosity and progresses back and forth in a nearly horizontal line on the H-R diagram. Iron is the end of the line, however, as fusing heavier elements requires the addition of energy, rather than liberating energy. Once central fusion ends for good, the core rapidly collapses (on the order of seconds!), heating up and then rebounding in a tremendous explosion that releases an amount of energy rivaling that of an entire galaxy--this explosion is called a supernova. The remaining core collapses into either a neutron star, or if massive enough, into a black hole. |
 |
REFERENCES
1. Prialnik, Dina, "An Introduction to the Theory of Stellar Structure and Evolution." Cambridge University Press, 2010 (2nd ed)