Open Cluster Project | |||
| « Previous | Back to Astrophotography Gallery | Next » | |
Open star clusters are groups of stars, loosely bound together by gravity, that formed from the collapse of the same giant molecular gas cloud. The stars within a given cluster all formed at approximately the same time, and since they formed from the same gas cloud, they share a common composition. The primary difference between individual stars within the cluster is therefore their mass. Since all the stars within a given cluster are approximately the same distance from us (the distance between individual stars is much smaller than the cluster's distance from earth), an observational (using apparent magnitude) color-magnitude (H-R) diagram can be constructed for each cluster without knowing their actual distance from us. Most stars within a given open cluster lie on the "Main Sequence" (see bottom of page), a roughly diagonal line from the upper left to lower right of the H-R diagram. In these diagrams, the hottest (bluest) and most massive stars lie to the upper left, while the coolest (reddest) and least massive stars lie to the lower right. Since a stars lifetime is inversly proportional to its mass, the most massive stars within a cluster burn up their hydrogen fuel first, and when core hydrogen burning is finished, these stars transition from the Main Sequence to the Red Giant stage of their lives, moving roughly horizontally to the right side of the H-R diagram. As the star cluster ages, stars along the Main Sequence slowly peel-off from the diagonal line, starting from the upper left and moving progressively down the diagonal Main Sequence line. At any given time (the present), the point at which the stars appear to be leaving the Main Sequence can be used to estimate the cluster's age. In an attempt to add some "science" to my astro-imaging, I decided to try and make a series of color-magnitude diagrams of different open star clusters. I purchased two photometric filters, Besler "V" and "B", from Chroma Filters. I then took a series of different exposures for each cluster through both filters (along with exposures through Red, Green and Blue filter to make an RGB image of the cluster). Using the 'Aperture Photometry' script in Pixinsight (I am constantly amazed at all the things that Pixinsight can do!) to measure each star's brightness through both photometric filters, and calibrating the results to known star brightnesses, the stars apparent brightness (V magnitude) can be plotted against its color index (B-V magnitude) to create an Observational Color-Magnitude Diagram for each cluster. The apparent magnitudes were corrected for camera quantum efficiency (manufacturer's curve) at the 2 filter wavelengths, and for the 'airmass' (path length through the atmosphere). The next step is to convert the Observational Color-Magnitude diagram to one based on Absolute Magnitudes, so that the different clusters can be compared on a uniform basis. This requires two corrections: one for distance from earth to the given cluster following the inverse-square law, and a second for interstellar extinction and reddening--the attenuation of starlight by dust in the interstellar medium. For these corrections I used data found in available literature (see reference list below) for distance, and when available, interstellar extinction. For each open cluster below, a color RGB image of the cluster is presented; the circle represents the commonly accepted diameter of the cluster. Also presented is the Absolute Color-Magnitude Diagram as determined with the photometric filters (V and B) for the brighter stars lying within the circle. Since it is not a trivial task to determine which stars are actually members of the cluster and which are foreground or background stars, for the current project all stars lying within the circle are assumed to be cluster members. The data presented here included stars down to an apparent magnitude of 12. (Note that the color-magnitude diagrams are superimposed on the publicly available Hipparcos H-R diagram for reference purposes.) | |||
Open Cluster M39 (NGC7092) | |||
 |
 |
||
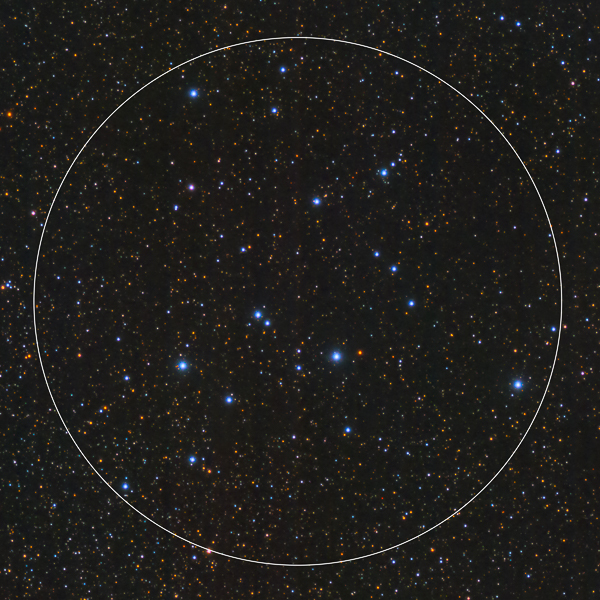
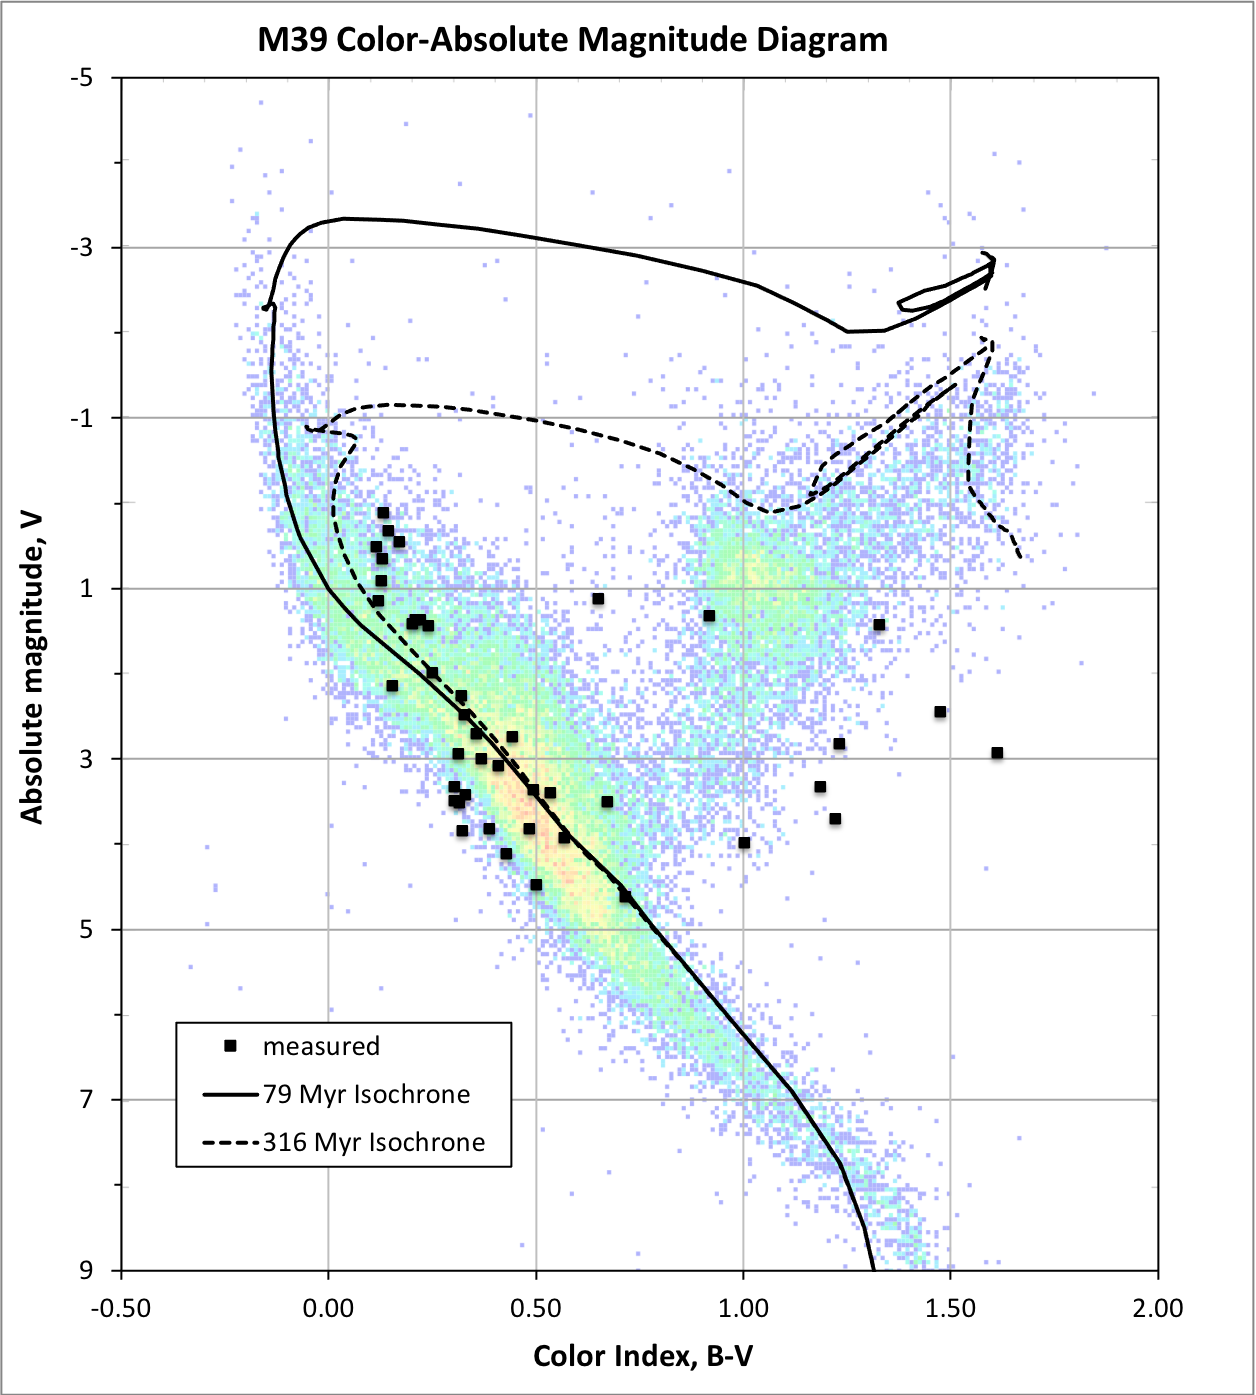
Messier 39 (M39) is a loose cluster of fairly bright stars that stand out clearly from the background Milky Way. The cluster is located in the constellation Cygnus the Swan, and in this image the main stars of the cluster appear distinctly blue. Reference 8 estimates the age of the cluster at ~ 79 Myrs. At least one reference states that all the proven members of the cluster are Main Sequence stars; assuming this to be true, the stars to the right of the Main Sequence in my color-magnitude diagram are not likely members of the cluster, but rather foreground/background stars. Also shown are two isochrones for cluster ages of 70 Myrs and 316 Myrs for reference (see isochrone definition at bottom of page). | RA: 21h 31m 48s Diameter: 35 arc-mins Interstellar extinction: A(V) = 0.070 data from Reference 2 | Dec: 48° 26' 0" Distance: 310 pc (1010 light years) A(B) = 0.093 Est. age: 79 Myrs | |
Open Cluster Collinder 463 (CR463) | |||
 |
 |
||
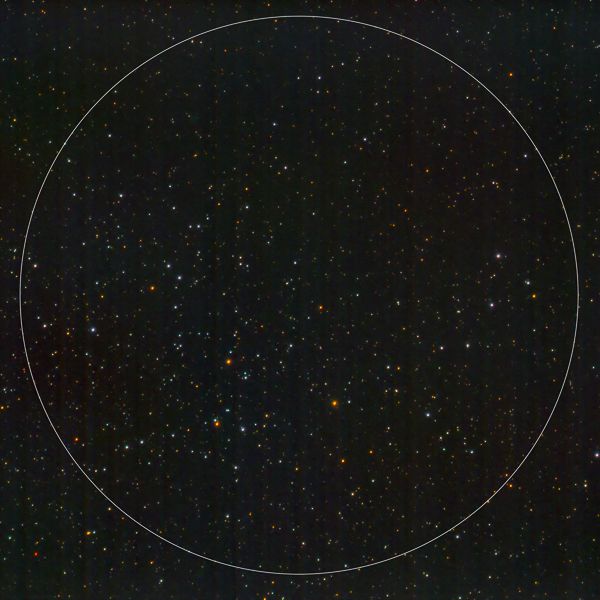
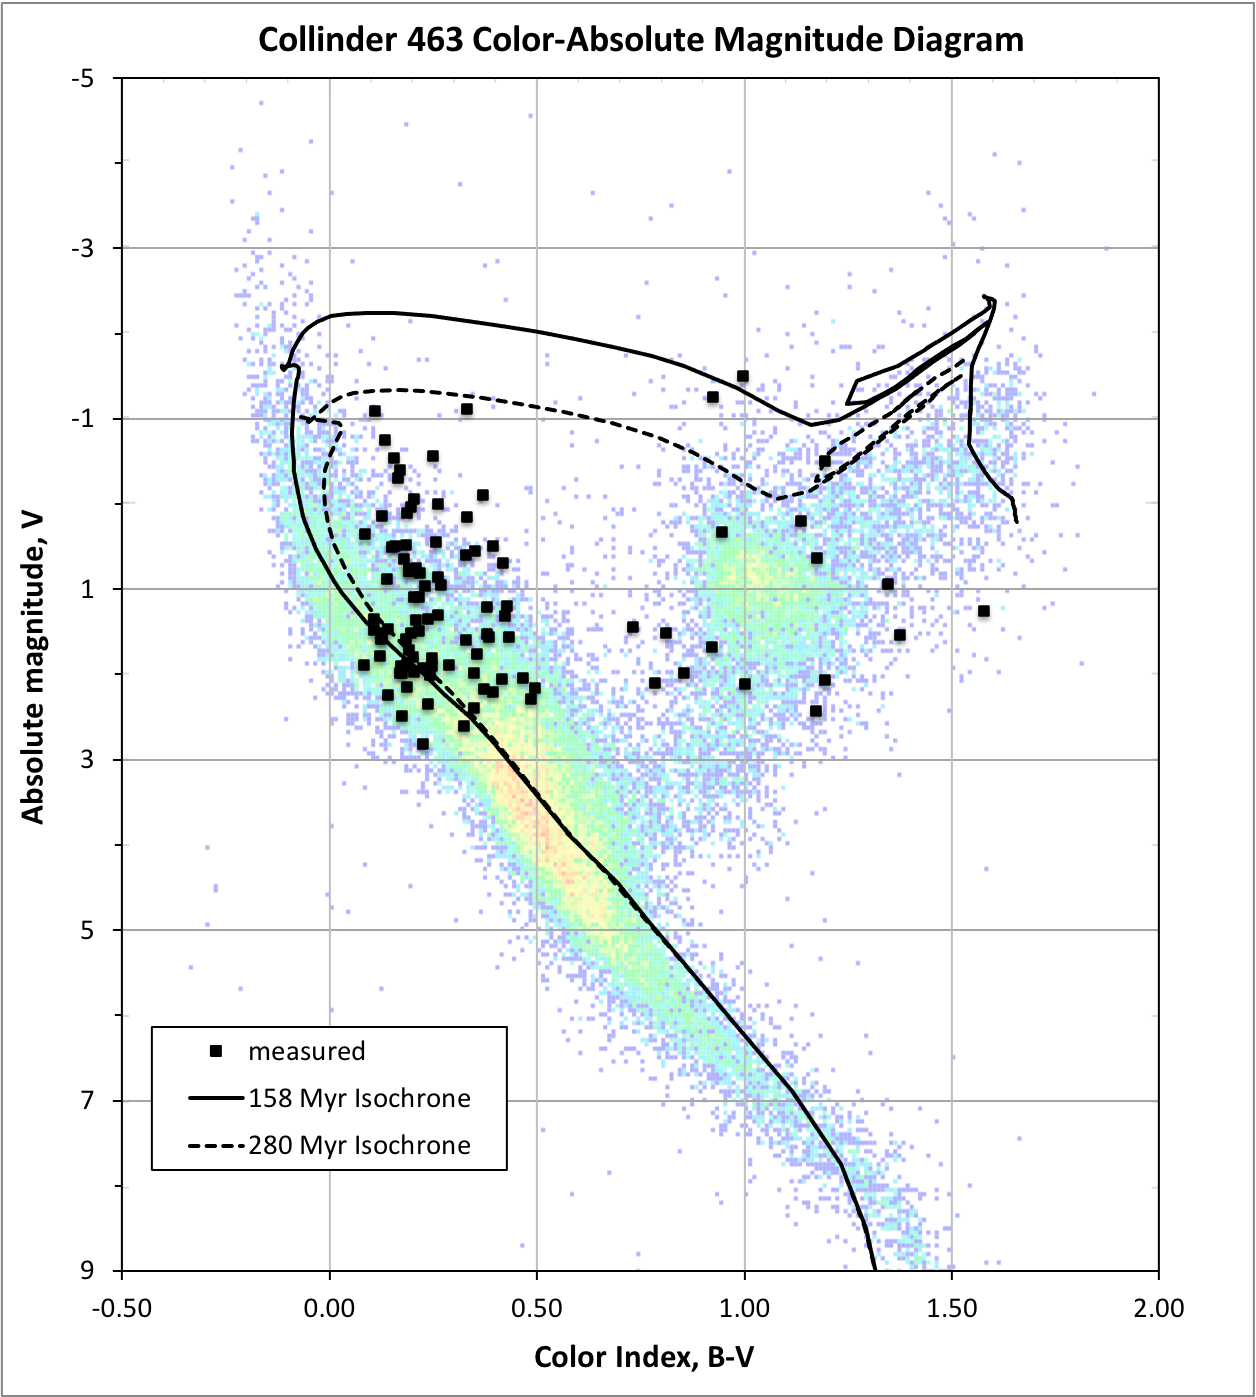
Collinder 463 is a "relatively poor galactic cluster" (Reference 4) located in the constellation Cassiopeia. The same reference estimates the cluster's age at 150 Myrs, and states that the cluster probably contains at least three giants. Two isochrones are shown for reference: 158 Myrs and 280 Myrs (see isochrone definition at bottom of page). | RA: 1h 47m 25s Diameter: 57 arc-mins Interstellar extinction: A(V) = 0.650 data from Reference 4 | Dec: 71° 54' 8" Distance: 650 pc (2119 light years) A(B) = 0.861 Est. age: 150 Myrs | |
Open Cluster Stock 2 | |||
 |
 |
||
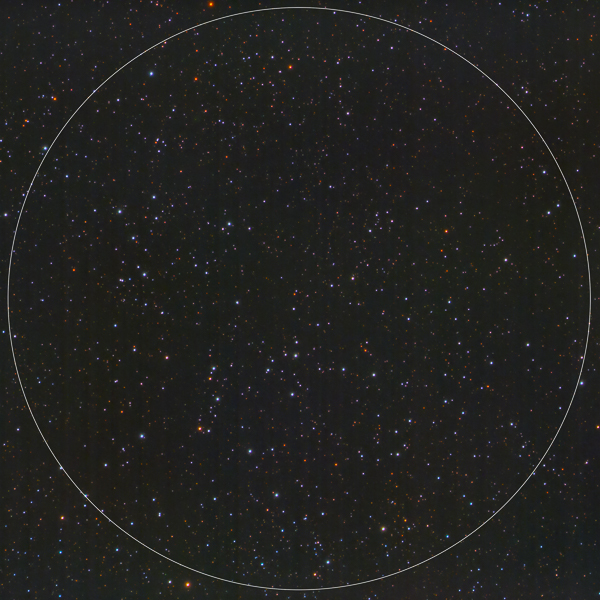
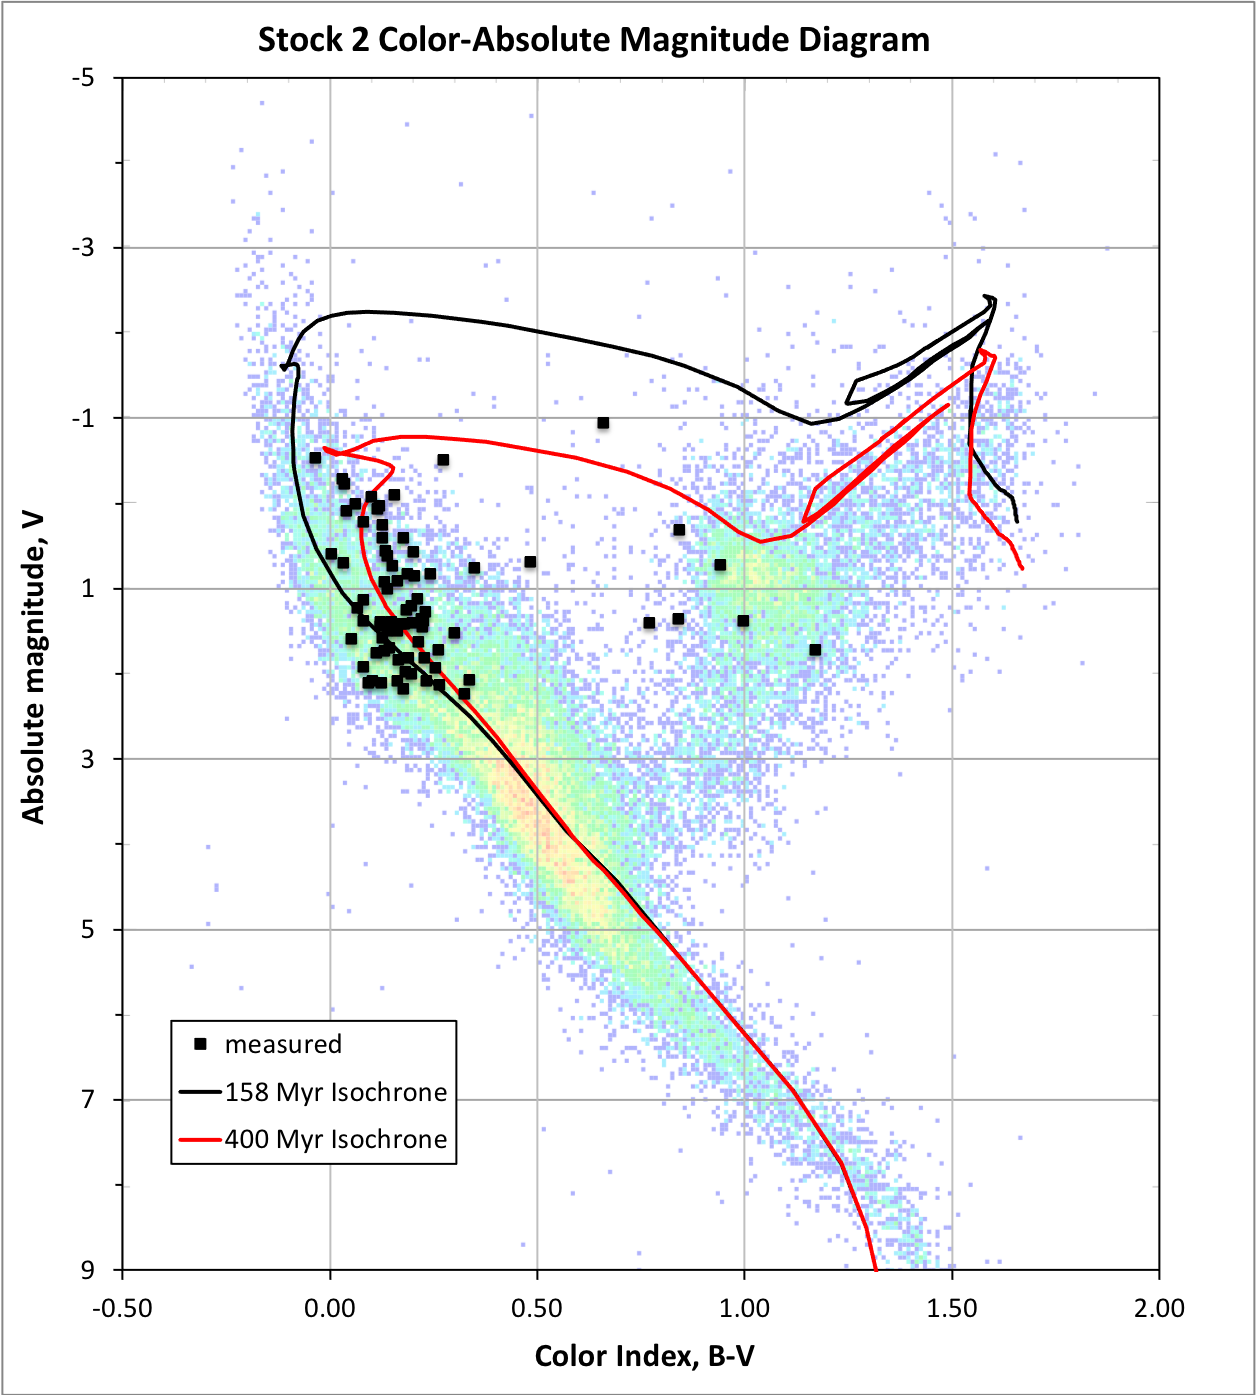
The open cluster Stock 2 lies in the constellation Cassiopeia. Reference 6 concludes that the cluster contains four red giants. Reference 6 also concludes that there is a "marked concentration of (interstellar dust) in front of Stock 2." Two isochrones are shown for reference: 158 Myrs and 400 Myrs (see isochrone definition at bottom of page). | RA: 2h 16m 11s Diameter: 60 arc-mins Interstellar extinction: A(V) = 1.264 data from Reference 6 | Dec: 59° 34' 42" Distance: 316 pc (1030 light years) A(B) = 1.636 Est. age: 100-275 Myrs | |
Open Cluster NGC 752 | |||
 |
 |
||
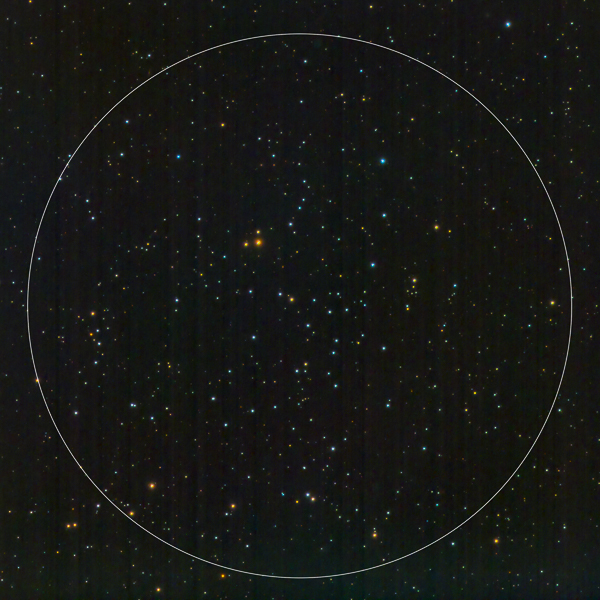
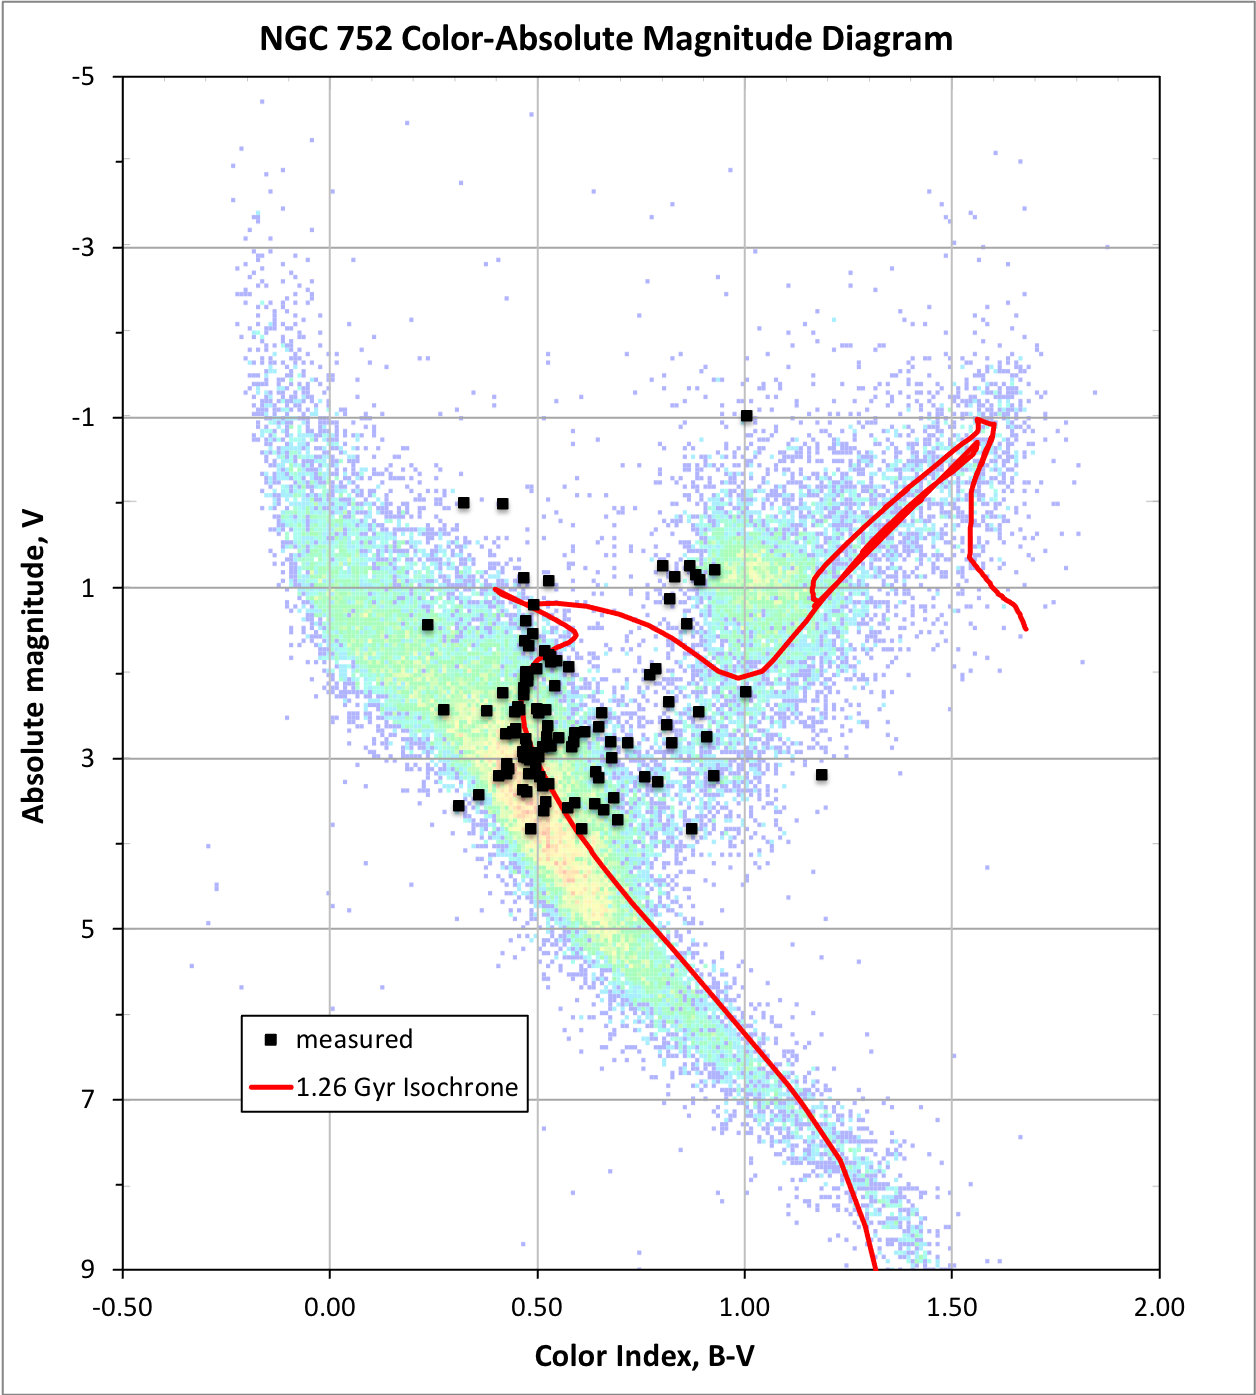
NGC is is a relatively bright open cluster in the constellation Andromeda. This cluster appears to be the oldest of those presented here, with an estimated age of 1.3-1.5 Gyrs. Reference 7 states that the cluster contains eight red giants. This is the only color-magnitude diagram constructed from my data that shows a clear Main-Sequence turnoff (at about M = 3.0), which is consistent with it being the oldest cluster of those shown here. Since there is such a clear turnoff, I took a shot at fitting an Isochrone (see below for definition of isochrone) to the data, shown as the red line in this plot. A 1.26 Gyr isochrone appears to give an excellent fit to the data, which is quite consistent with the estimated cluster age in the literature. | RA: 1h 58m 45s Diameter: 50 arc-mins Interstellar extinction: A(V) = 0.070 data from Reference 7 | Dec: 37° 50' 59" Distance: 435 pc (1418 light years) A(B) = 0.093 Est. age: 1.3-1.5 Gyrs | |
Double Cluster: NGC 884 and NGC 869 | |||
 |
 |
||
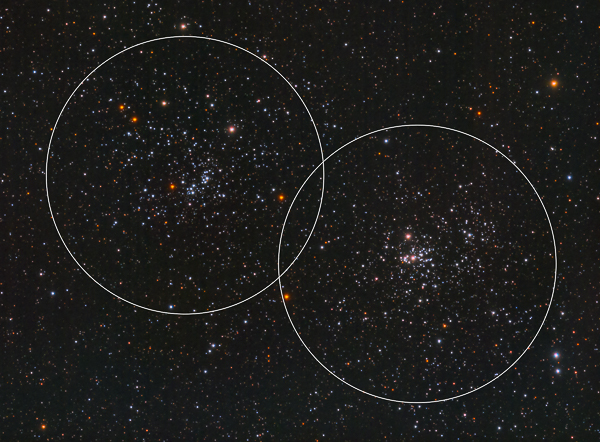
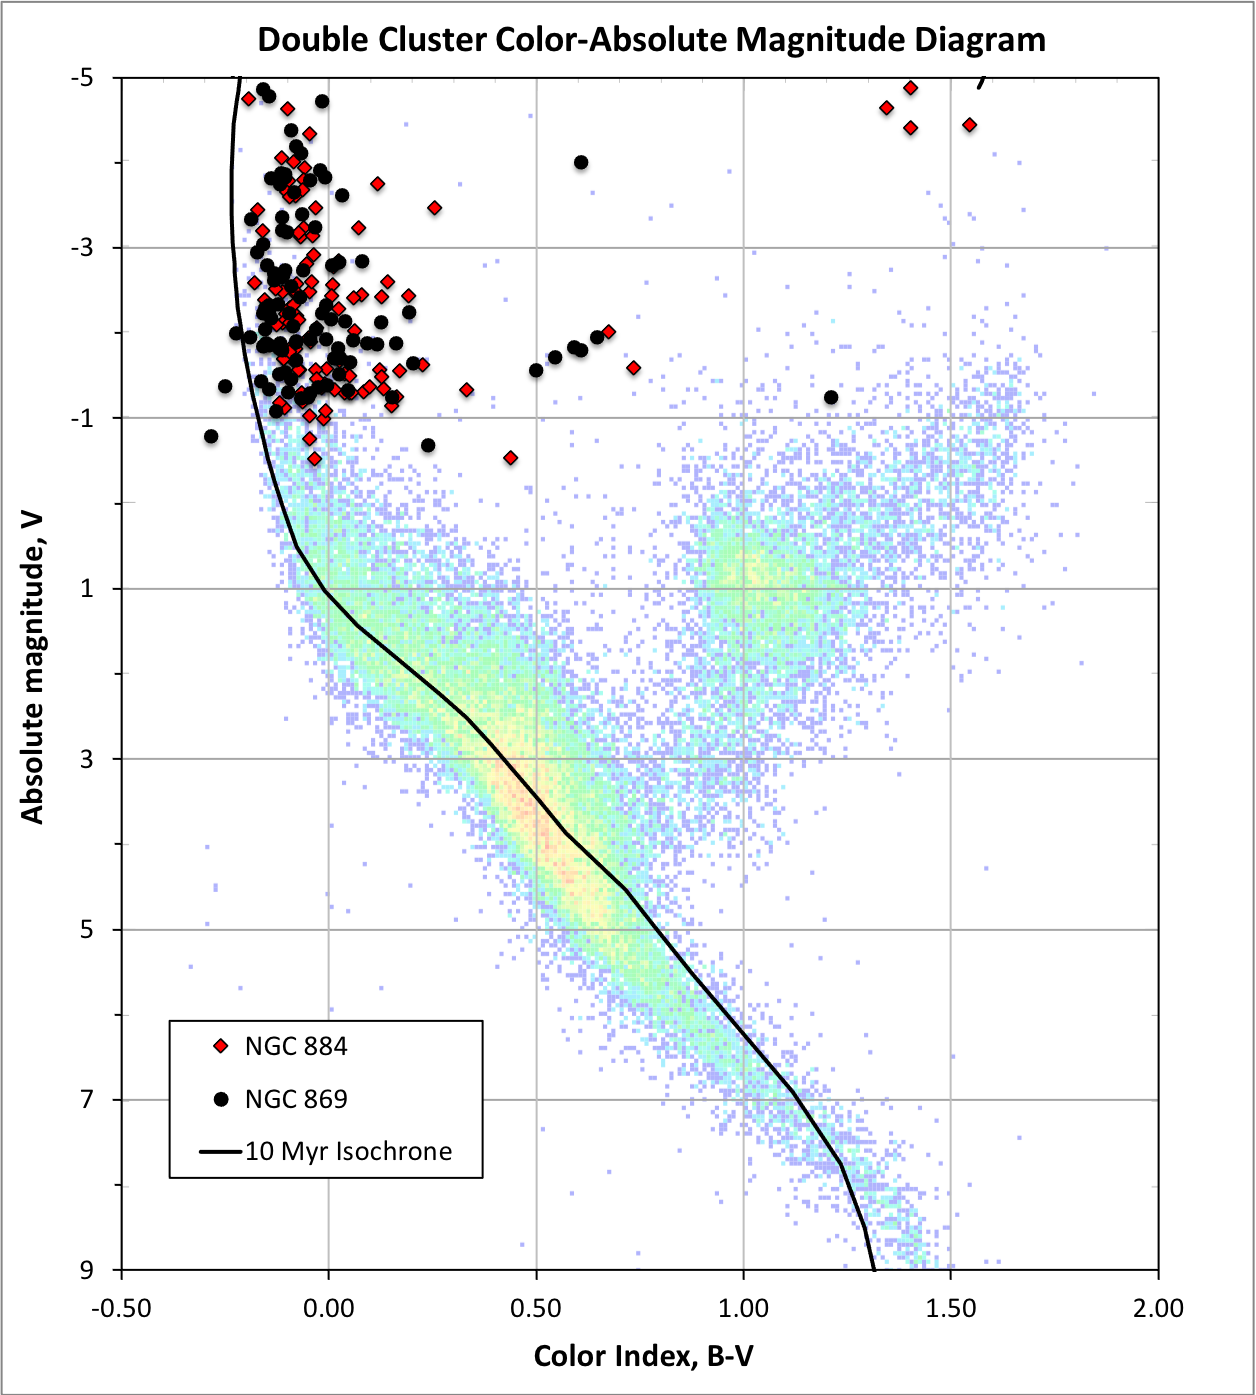
The Double Cluster in the constellation Perseus is comprised of the two clusters NGC 884 and NGC 869, and is probably one of the most famous star clusters in the northern sky. These two clusters are both the youngest and the furthest away of those presented here. Shown for reference is a 10 Myr isochrone, close to the estimated age for the cluster of 14 Myrs. | RA: 2h 22m 23s / 2h 19m 0s Diameter: 30 arc-mins Interstellar extinction: A(V) = 1.49 data from Reference 9 | Dec: 57° 7' 30" / 57° 7' 42" Distance: 2300 pc (7498 light years) A(B) = 1.973 Est. age: 14 Myrs | |
NGC 7789 - "Caroline's Rose" | |||
 |
 |
||
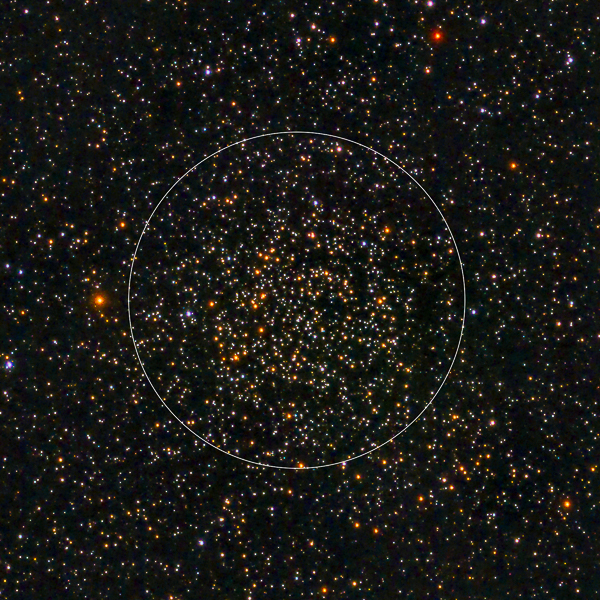
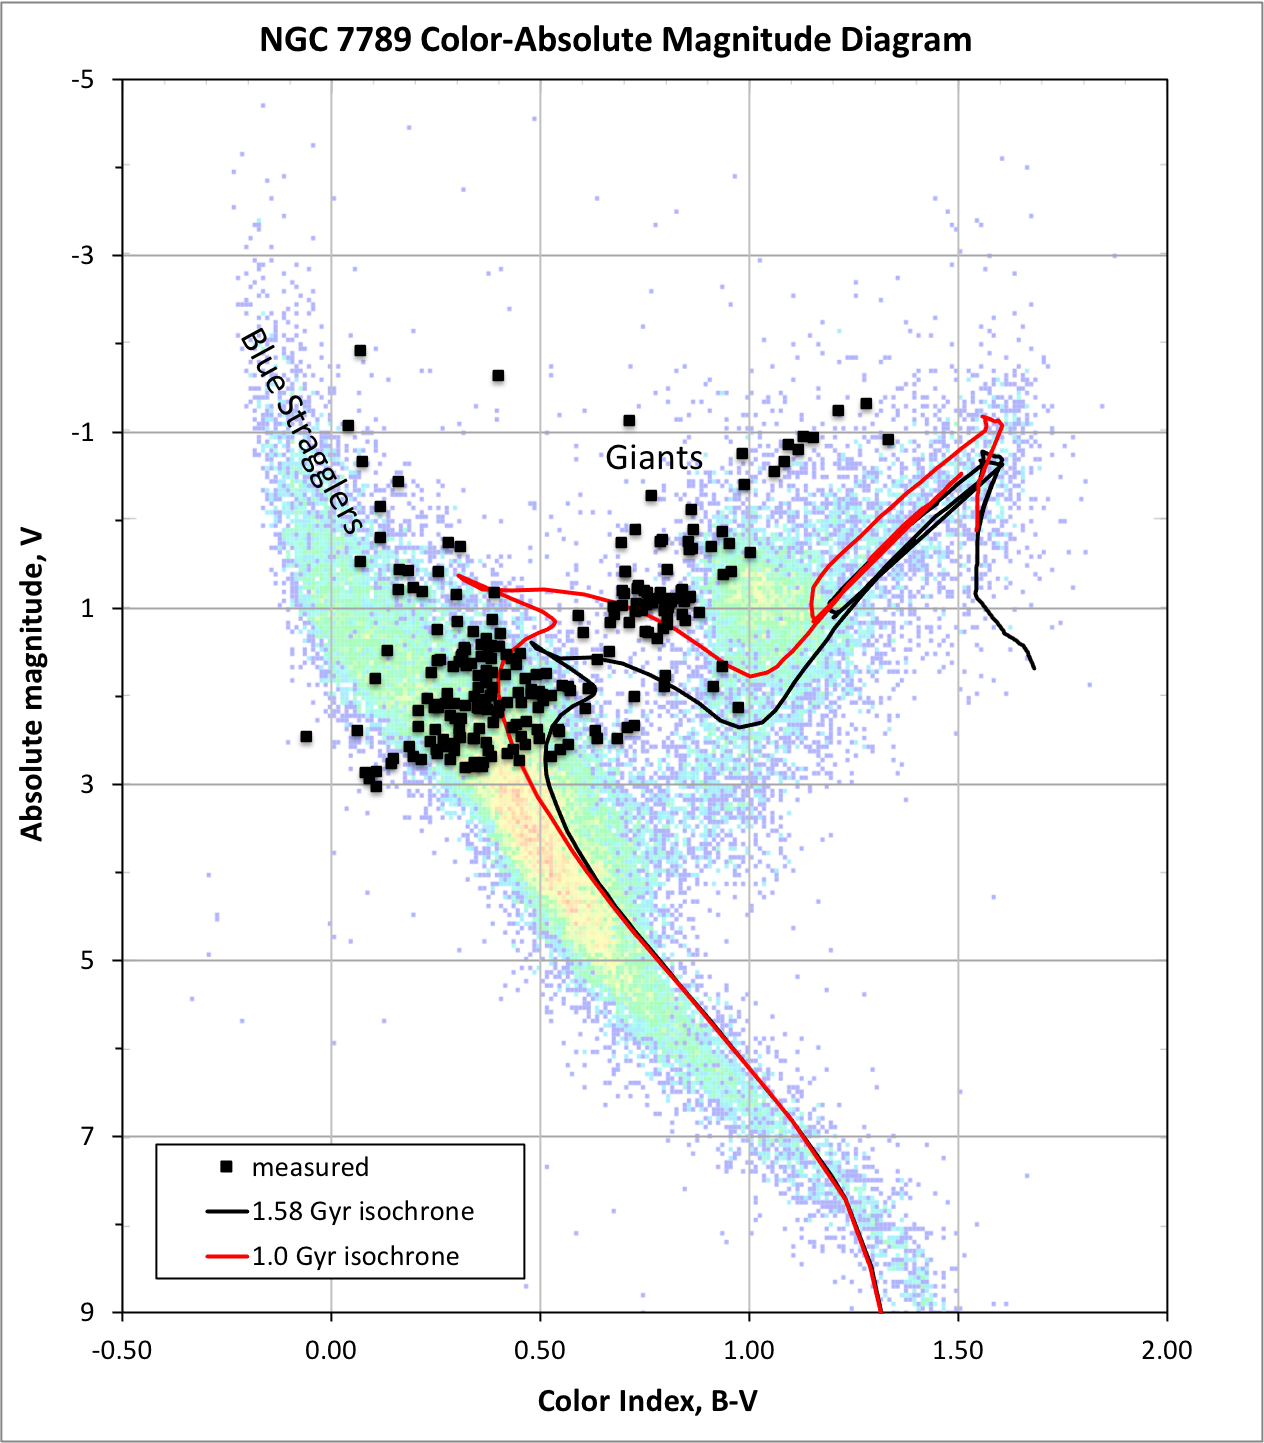
Caroline's Rose is a beautiful, and scientifically fascinating, open cluster. It is densly packed with colorful stars, and is very old for an open cluster. Because it is so old, with an estimated age of 1.1-1.4 Gyrs, many of its stars are well along their evolutionary path, and the cluster contains a large number of both red and yellow giants. In addition, the cluster contains a significant number of "blue stragglers," stars that are brighter and bluer than the Main Sequence turn-off point that indicates a cluster's age. The evolutionary explanation for these stars is still a matter of debate, as their position on the color-magnitude diagram would seem to defy either the assumption that all the stars in a cluster were born at the same time, or to defy stellar evolution theory. Several possible explanations for these stars have been put forth and studied; the main ones seem to be: 1) a new generation of stars, born later than the majority of the cluster 2) "captured" field stars, not born with the other cluster memebers 3) close-binary stars with mass exchange between the orbiting stars. | RA: 23h 57m 24s Diameter: 16-25 arc-mins Interstellar extinction: A(V) = 0.865 data from Reference 11 | Dec: 56° 42' 30" Distance: ~1800 pc (5868 light years) A(B) = 1.145 Est. age: 1.1-1.4 Gyrs | |
M44 - "Beehive Cluster" or Praesepe (AKA NGC 2632, Cr 189) | |||
 |
 |
||
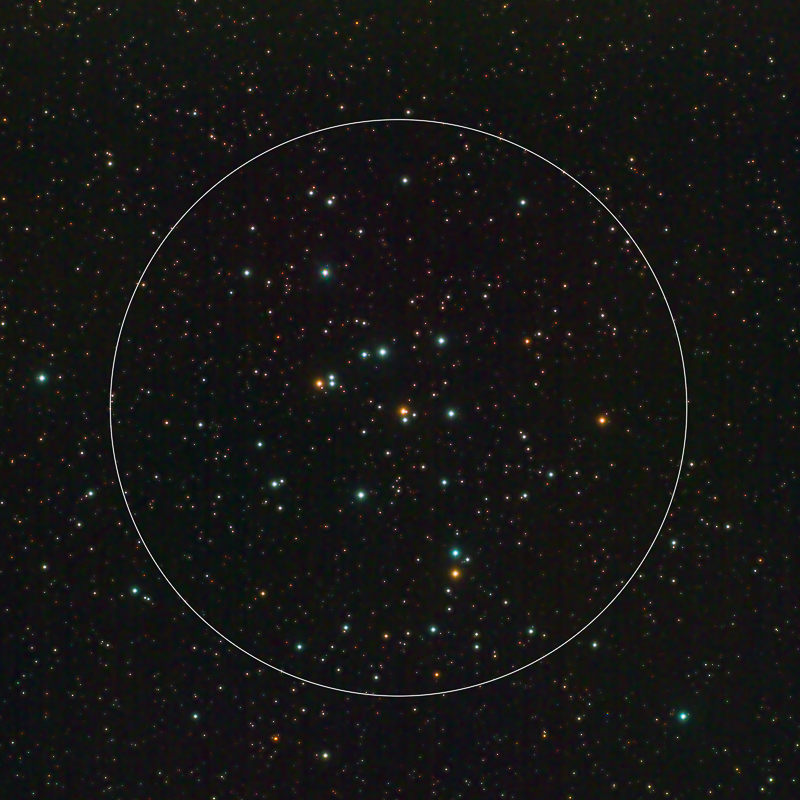
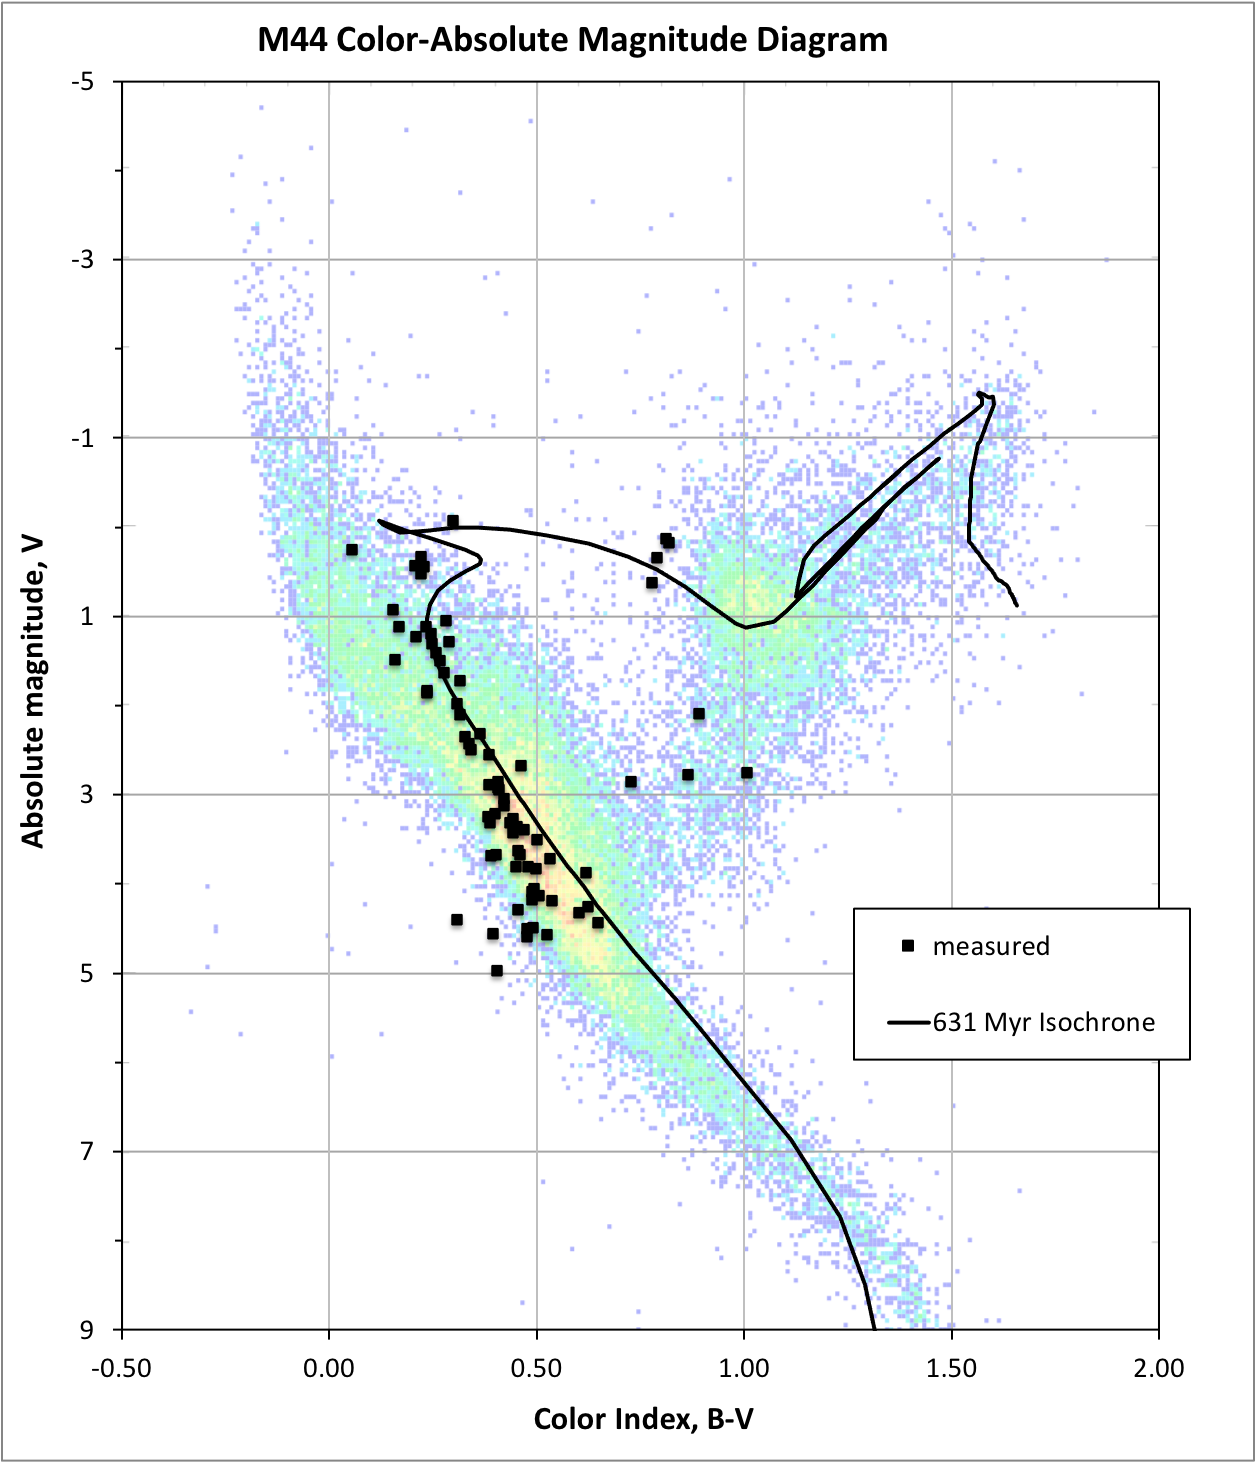
M44, also known as the Praesepe or "Beehive" cluster, is located in the constellation Cancer and has been known since ancient times and studied by both Ptolemy and Galileo. One of the closest open clusters to our solar system, its age and proper motion are similar to the Hyades cluster, and some believe they may be related. The cluster contains at least five giant stars according to references. |
RA: 8h 40m 24s Diameter: 70 arc-mins Interstellar extinction: A(V) = 0.033 data from Reference 2 | Dec: 19° 40' 0" Distance: 190 pc (619 light years) A(B) = 0.044 Est. age: 600-900 Myrs | |
Composite Open Cluster Color-Magnitude Diagram | |
 |
At left is a composite plot of the above color-magnitude diagrams, allowing a comparison of the basic characteristics of the star clusters to each other, in particular, their estimated ages. The members of the Double Cluster in Perseus (NGC 884 and NGC 869), being the youngest of the clusters shown here, still has most of its members lying on the Main Sequence, and those stars extend the furthest to the upper left of the diagram. In contrast, NGC 752 is the oldest cluster shown, and it appears to show a clear turn-off point at approximately magnitude 3, the furthest down the Main Sequence line. This is consistent with what is expected, as well as figure 13.19 on page 478 of Reference 1. Three stellar isochrones are shown on the plot for reference: 10 Myrs, 400 Myrs and 1.26 Gyrs. The youngest and oldest were chosen as they closely approximate the literature ages and current data for the Double Cluster and NGC 752, repsectively; the 400 Myrs is simply an intermediate age that appears to be a reasonable match for the other cluster data points. Equipment used in this project: Stellarvue SVT-102 refractor, ASI1600MM cooled astronomy camera, Astronomik RGB filters and Chroma V & B photometric filters. |
What is a Color-Magnitude / H-R Diagram? | |
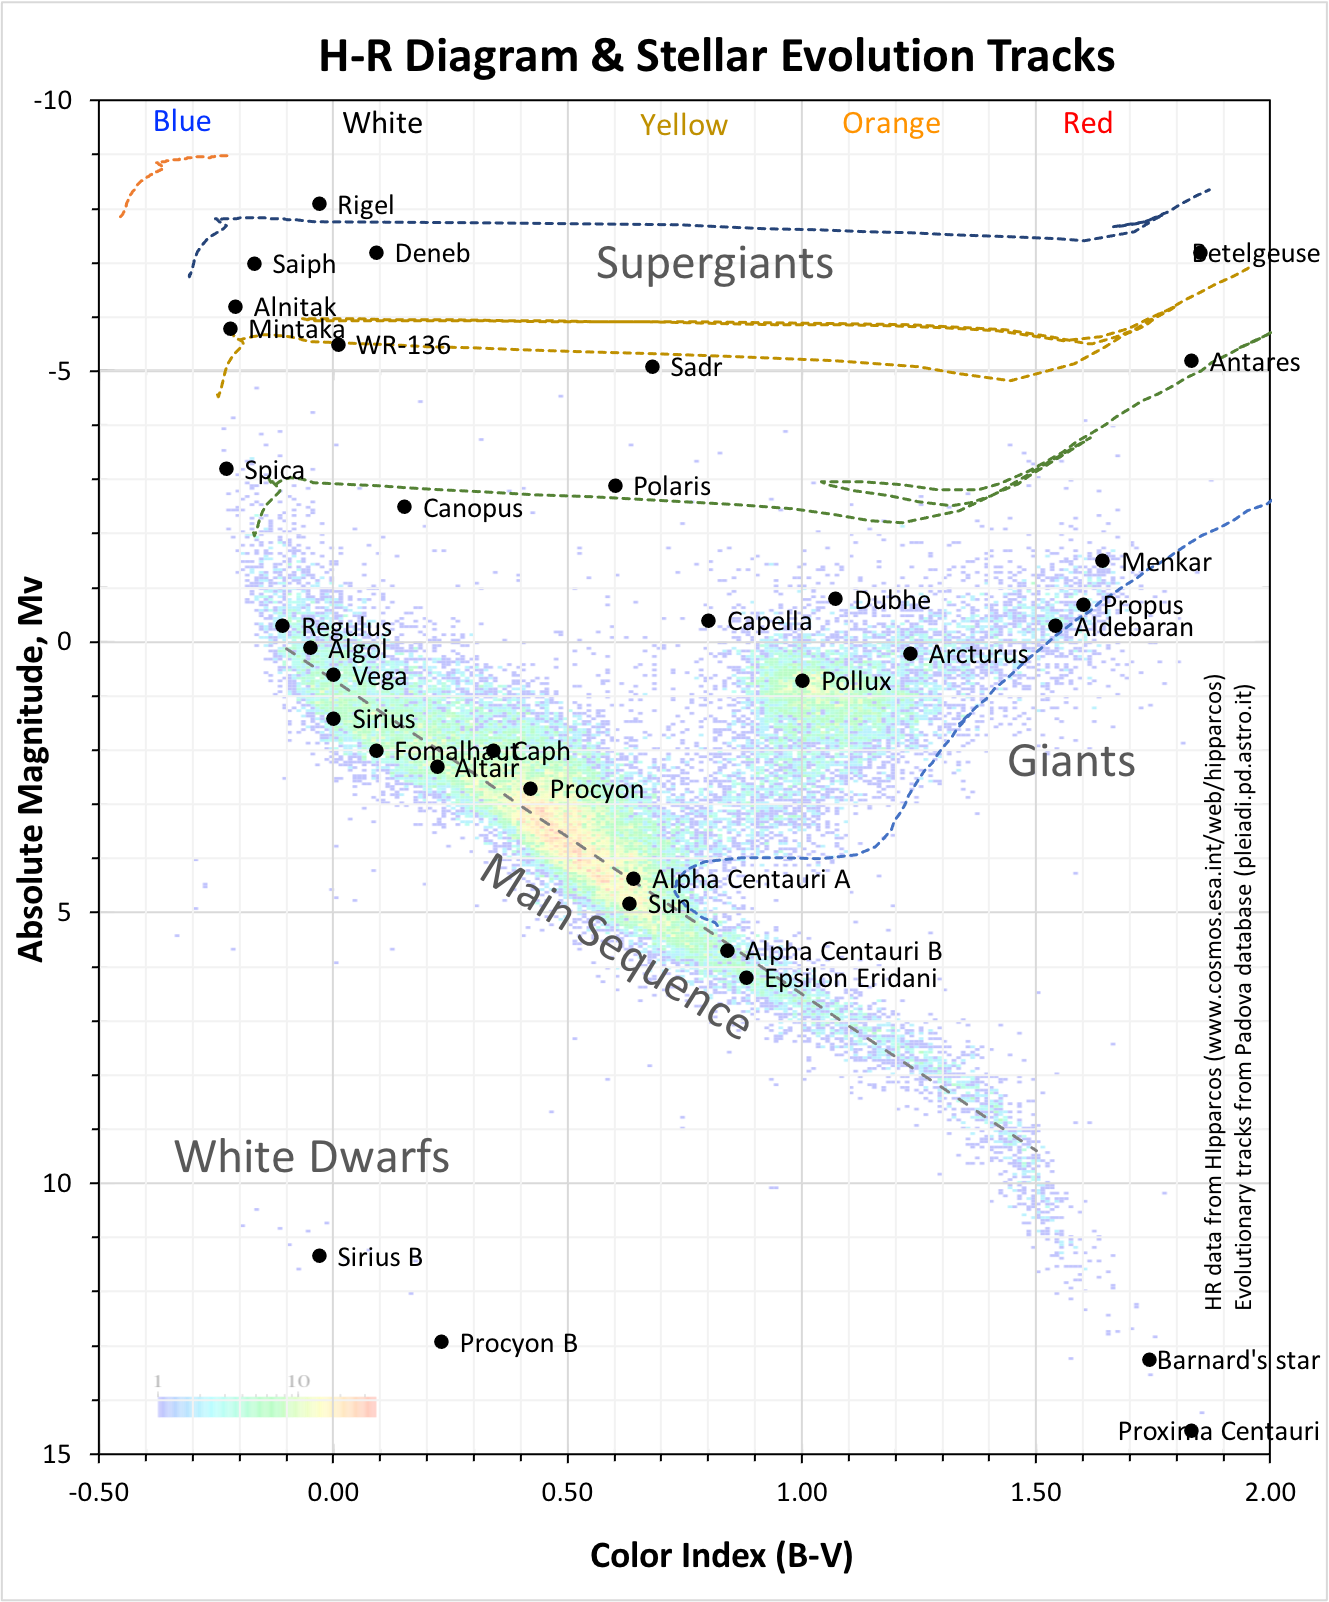 |
In the early twentieth century two astronomers, Ejnar Hertzsprung and Henry Russell, independently studied available data for stars whose properties had been accurately determined, and created plots of the stars absolute magnitude on the vertical axis vs. their spectral type on the horizontal axis. The resulting scatter plots showed that the majority of stars fell on a nearly straight diagonal line, now called the 'Main Sequence,' from the upper left to the lower right of the plot. These diagrams, now called Hertzsprung-Russell (H-R) or color-magnitude diagrams, became an important tool in the study of stellar evolution. An observational color-magnitude diagram plots apparent magnitude vs. color index (roughly proportional to spectral type or effective temperature). If distance information is available, then the absolute magnitudes can be determined and the data replotted to create an absolute color-magnitude diagram. (Note that stellar distances are one of the most difficult properties to determine.) At left is a color magnitude diagram taken from the Hipparcos mission website (www.cosmos.esa.int/web/hipparcos/h-r-diagrams) to illustrate the basic H-R Diagram (annotations added). The majority of stars lie along the Main Sequence, a roughly S-shaped diagonal line running from upper left to lower right. The vertical scale of the plot is the absolute magnitude of the star (the stars brightness), and the horizontal scale is the (B-V) color index (proportional to the stars surface temperature). Stars generally spend the majority of their lives on the Main Sequence fusing hydrogen to helium in their cores. The hottest, bluest and most massive stars burn the brightest, but have the shortest lives, and lie to the upper left of the diagram. The coolest, reddest and least massive stars live the longest, and lie to the lower right side of the diagram. Once a star has exhausted the hydrogen in its core, it migrates toward the right side of the H-R diagram as its core contracts, but outer envelope expands and surface temperature drops, evolving into a Red Giant or Red Subgiant. The remainder of the stars evolution, and eventual death, is determined by its mass. The (background image) color-magnitude diagram shown here is from the Hipparcos catalogue and can be found here Hipparcos Hertzsprung-Russell Diagrams Also shown as dotted lines in the diagram are Stellar Evolution Tracks for stars of 1, 5, 10, 20 and 30 solar masses. Each of these tracks shows how a given star of constant mass progresses throught the H-R diagram during its lifetime. The evolution tracks shown here are based on theoretical models from the Padova Database (link below). Some bright, named stars are shown in the diagram as well, including the Sun. |
What is a Stellar Isochrone? | |
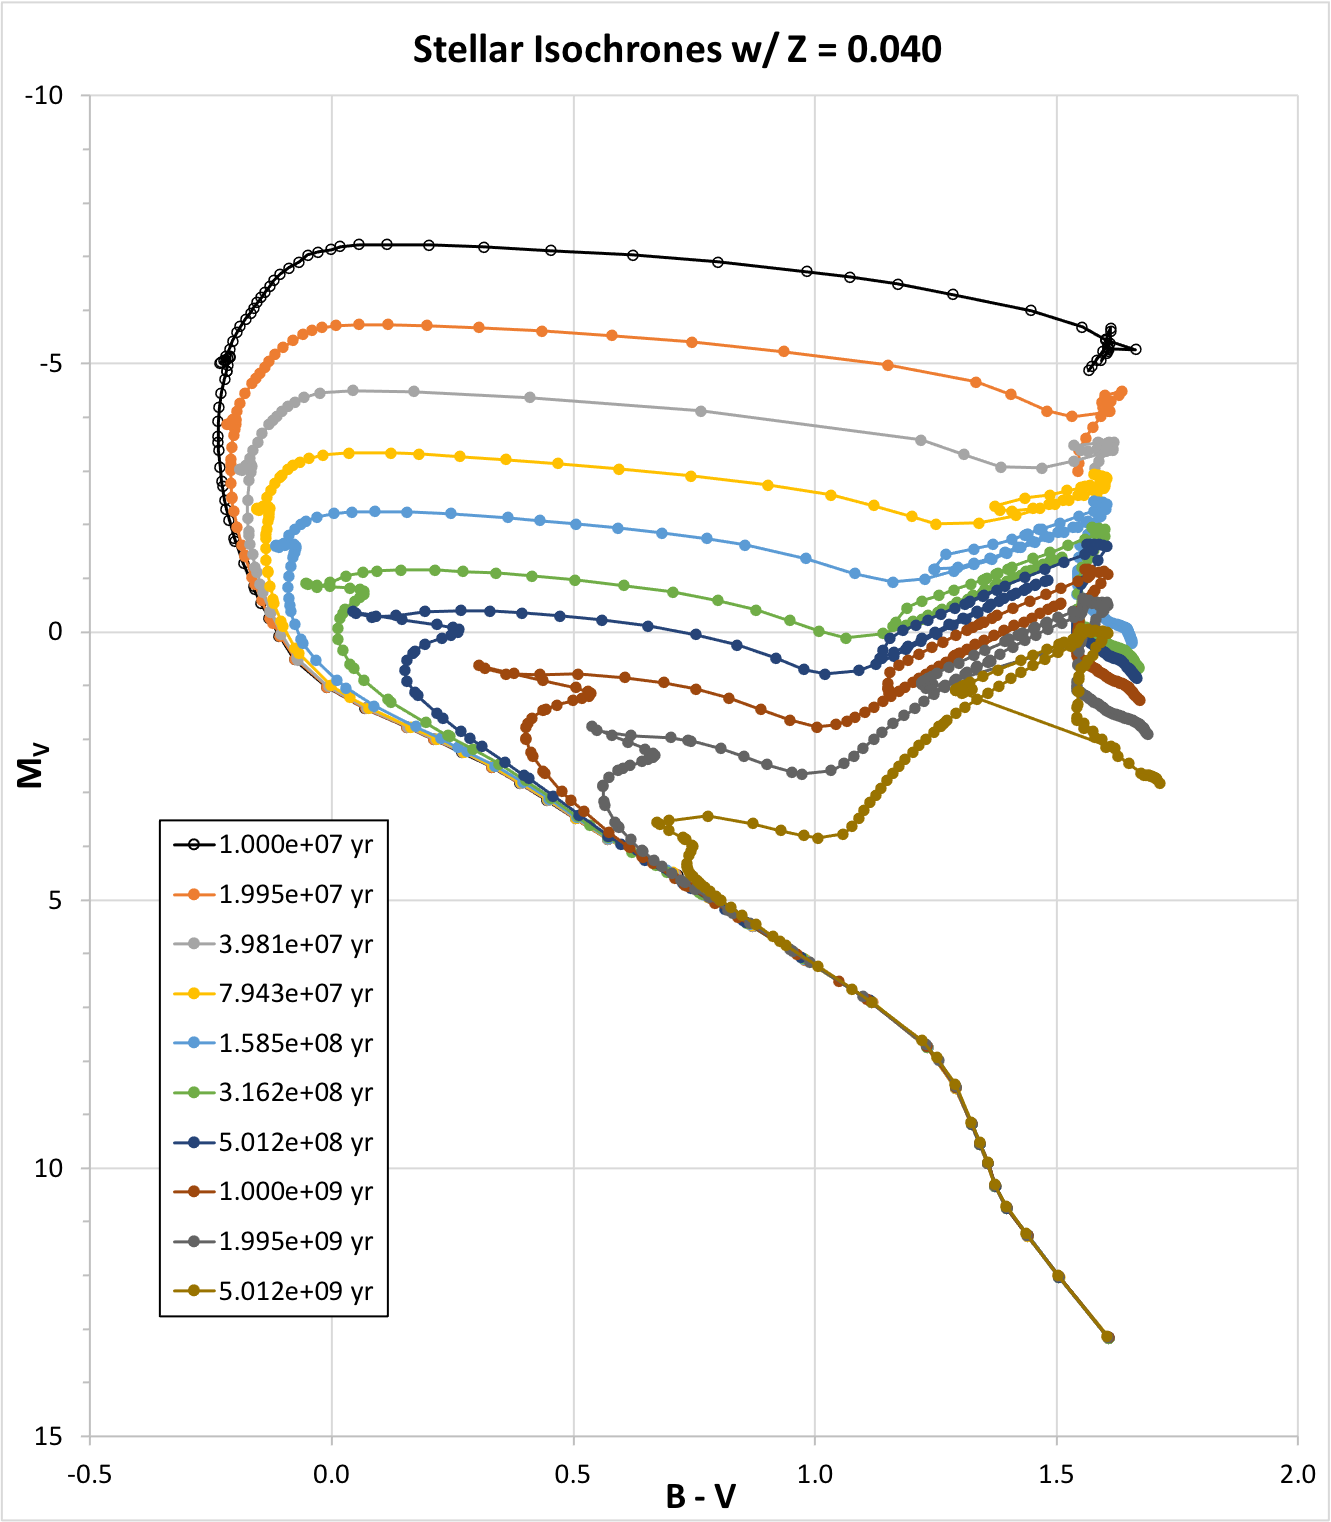 |
Stellar isochrones are lines on an H-R (color magnitude) Diagram that represent stars of different masses, all having the same age. These are theoretical curves calculated using stellar evolution codes. Note that they are NOT Stellar Evolution Tracks (as shown above) of a given star, but are rather derived from such tracks. If evolution tracks are calculated for a variety of initial stellar masses, say 1, 5, 10, 20 and 50 solar masses, and the life history of each star is traced out, and then the data is reorganized by age, the result are stellar isochrones. Plotted at left are a series of stellar isochrones take from Reference 10 below. These isochrones can be thought of as what the shape of the color-magnitude diagram for a star cluster of a given age should look like. They are useful for estimating the age of a star cluster that is presumed to consist of a group of stars that all formed at approximately the same time, whose members therefore share a common age. By fitting an appropriate isochrone to a star cluster's color-magnitude diagram, paying particular attention to the Main Sequence turnoff point, the age of the cluster can be estimated. The isochrones shown here were taken from: Padova database of stellar evolutionary tracks and isochrones |
DISCLAIMER: Please note that I am not an astrophysicst, but simply an amateur astronomer and astrophotographer. I am trying to learn some astrophysics and add some science to my hobby of astrophotography. My explanations above are intended as a brief introduction to what I have been learning, and to attempt to give some context to my efforts.
REFERENCES
1. Carroll and Ostilie, "An Introduction to Modern Astrophysics, second edition." Cambridge University Press, 2017
2. Nicolet, B. "Geneva Photometric Boxes, III. Distances and Reddenings for 43 Open Clusters." Astronomy and Astrophysics, 104, 185-197, 1981.
3. Yen et al., "Reanalysis of Nearby Open Clusters Using Gaia DR1/TGAS and HSOY." Astronomy and Astrophysics, 615, A12 (2018).
4. Towsend, Ray E, "UBV Photometry of Collinder 463." Publications of the Astronomical Society of the Pacific, 87:753-757, October 1975.
5. Roman, Nancy, "The Spectrum-Luminosity Diagram for NGC 752." Astrophysical Journal, vol 121, p. 454, 1955
6. Krzeminski and Serkowsk, "Photometric and Polarimetric Observations of the Nearby Strongly Reddened Open Cluster Stock 2". Astrophysical Journal, vol 147, p. 988, March 1967
7. Roman, Nancy, "The Spectrum-Luminosity Diagram for NGC 752." Astrophysical Journal, vol 121, p. 454, March 1954.
8. Lindoff, Ult, "The Ages of Open Clusters." Arkiv for Astronomii, Vol. 5, p. 1-21, 1968.
9. Chengyuan et al., "Extended Main-Sequence Turnoffs in the Double Cluster h and Hie Persei: The Complex Role of Stellar Rotation." The Astrophysical Journal, 876:65, 2019 May 1.
10. Girardi et al., "Theoretical Isochrones in Several Photometric Systems." as yet unpublished. www.pleiadi,pd.astro.it.
11. Xin-hua Gao, "Memberships, Distances and Proper Motions of the Open Clusters NGC 2112, NGC 2477, NGC 7789 and Collinder 261 from Gaia-DR2." Publications of the Astronomical Society of the Pacific, 130:124101, 2018 December
12. Adams et al., "Structure of the Praesepe Star Cluster." The Astronomical Journal, 124:1570-1584, 2002 September.